Dimethyl Ether (DME) Production

Author: Marcello De Falco , Associate Professor, University UCBM – Rome (Italy) 


1.Theme description

DME (Dimethyl Ether) is an organic compound mainly used as aerosol propellant and as a reagent for the production of widely applied compounds as the dimethyl sulfate (a methylating agent) and the acetic acid[1].

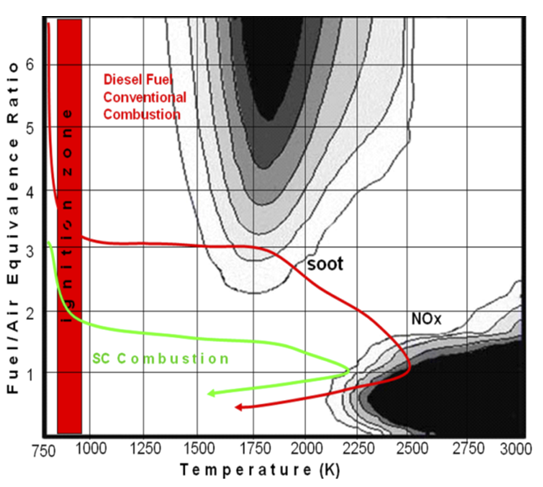
Recently, companies as Topsoe, Mitsubishi Co. and Total focus their effort to promote DME as a new and sustainable synthetic fuel that can substitute the liquefied petroleum gas (LPG) or blended in fuel mixture thank to its excellent combustion properties (cetane number = 55-60). DME has the potentiality to be fed into diesel engine, which would be only slightly modified, and its combustion prevents soot formation[2],[3].

Also the DME conversion to hydrocarbons is a relevant emerging market[4]. The processes usually known the general terms “Methanol-to-Hydrocarbons” (MTH), Methanol-to-Olefins” (MTO), Methanol-to-Propylene” (MTP), Methanol-to-Gasoline” (MTG) and Methanol-to-Aromatics” (MTA) are more effective if the starting reagent is DME instead of methanol.

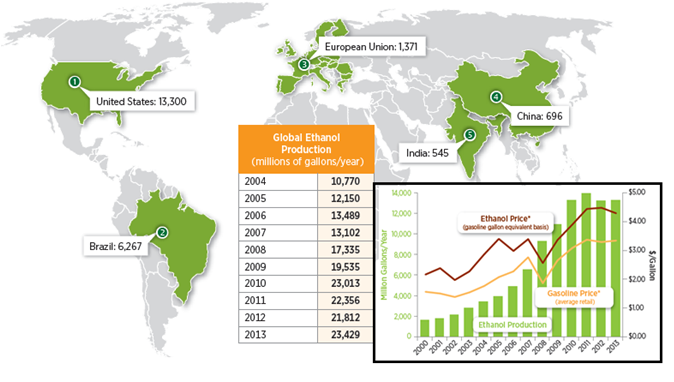
For all these reasons, a projected value of DME market equal to 9.7 bln USD by 2020 is foreseen, with a yearly growth of 19.65% between 2015 and 2020[5].

DME is usually produced  directly from syngas (CO/H2 mixtures with a eventual amount of CO2, typically below 3%) or by dehydration of methanol, which in turn is produced by syngas. Syngas can be generated from fossil fuels (coal, methane) or renewable sources as biomass or renewable electricity. Moreover, there is a growing interest on direct DME production from CO2-rich mixture.

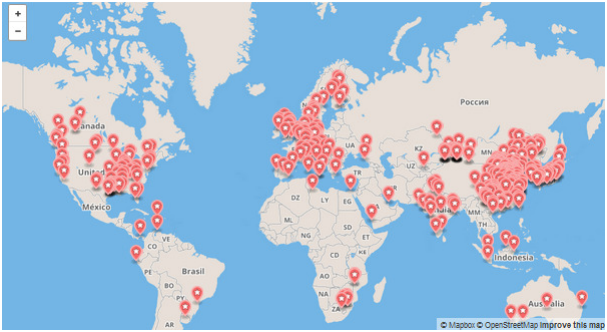
In the following, an overview of DME production processes applied worldwide is reported and, then, the major production plants actually operative are described.

2.Production Processes

2.1 Direct and Indirect production process

In industrial applications, the DME is produced from the syngas by means of two different configurations[6]:

  • one-step process;
  • two-steps process.

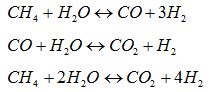
In the one-step process (direct production process), DME is produced directly from the syngas in one single reactor where a bifunctional catalyst supports both the methanol formation and the methanol dehydration according to the following reactions scheme[7]:

Methanol formation:      CO + 2H2 ↔ CH3OH             DHo = – 90.4 kJ/mol

Water-gas shift:             CO + H2O ↔  CO2 + H2                  DHo = – 41.0 kJ/mol

Methanol dehydration:  2CH3OH ↔  CH3OCH3 + H2O         DHo = -23.0 kJ/mol

Overall reaction:          3CO + 3H2 ↔  CH3OCH3 + CO2     DHo = -258.3 kJ/mol

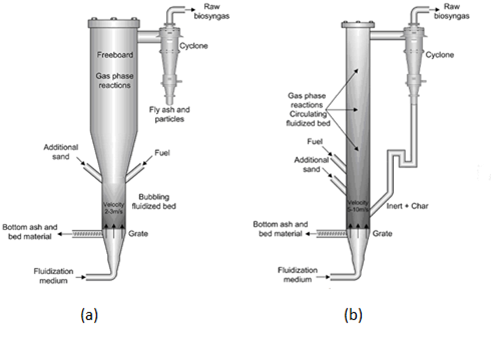
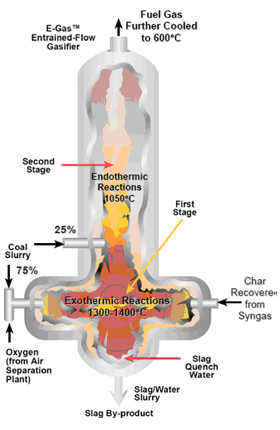
The syngas is produced by means of a natural gas steam reforming or coal/petroleum residues gasification and, after the DME synthesis reactor, a purification unit, able to separate the DME from water and methanol in a double distillation stage is needed. The following figure shows a diagram of the one-step process.

fig.2

In the two steps (indirect) process, the methanol formation from syngas and the DME production from methanol are supported in two separated reactors, where the specific catalysts (copper-based for the first, silica-alumina for the second) are packed. The figure illustrates the block diagram of this architecture.

fig.3

2.2 DME production from renewable energies

The reactants of the DME synthesis process can be produced from renewable energy as biomass, solar and wind. By this way, the DME is a sort of liquid energy vector, able to store the renewable energy in a easily dispensable, easy applicable and high-energy density fuel.

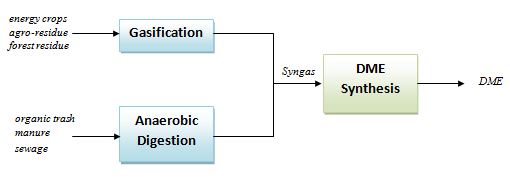
Starting from biomasses as energy crops, agro-residue, forest residue, etc., a gasification process can be applied to generate a syngas stream to be fed to one-step or two-steps DME synthesis process[8]. On the other hand, if the starting biomass is an organic trash, manure or sewage, an anaerobic digestion + pyrolysis system can be applied to generate the CO and H2 stream[9].

fig.4

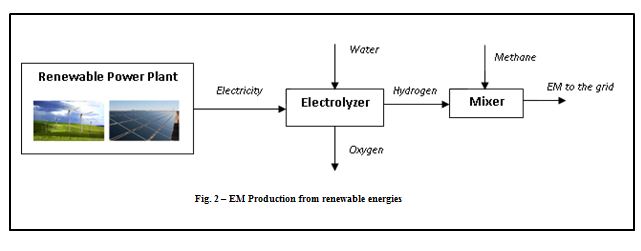
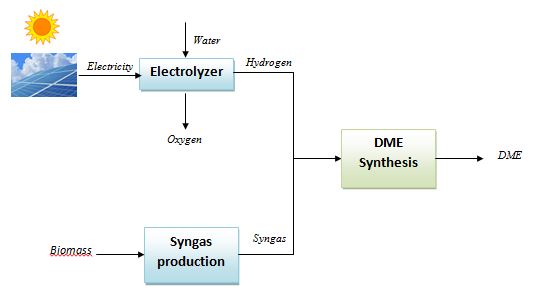
The hydrogen stream in the syngas mixture can be generated by an electrolyzer supplied by electricity produced from renewable power plants as photovoltaics and wind farms and then mixed with CO/CO2. By this way, the renewable energy is “stored” in the DME, which, being a liquid fuel, can be easily distributed, stored and used, differently from the hydrogen itself which has a series of unsolved issues related to the distribution and storage. The following scheme shows a conceptual layout of the DME production from solar/biomass energy.

fig.5

2.3 DME production as a CO2 valorization process

Instead of the syngas, a CO2-rich feedstock can be supplied to the DME production process, thus converting the CO2 in a high added value product. By this process, the CO2, which is the main GreenHouse gas (GHG), is not emitted but is converted into a fuel which can be burned releasing again the carbon dioxide[10],[11],[12].

Such a configuration is less developed than the conventional syngas-fuelled process, but many research efforts are devoted to improve its performance since it would allow both the production of DME and the reduction of GHG emissions, thus reducing the carbon footprint of DME synthesis.

CO2 presence in the reactor environment leads to two main issues:

  • CO2-rich feedstock influences the active state of the catalyst for methanol synthesis, reducing the rate of formation of methanol[13];
  • CO2 promotes the reverse Water Gas shift reaction, thus producing H2O and inhibiting the methanol dehydration.

The research is focused mainly on the development of new catalyst, tailored for CO2-rich mixture conversion, and of selective membranes able to remove water from the reaction environment, promoting the methanol dehydration reaction and the DME production[14],[15].

3.Operative plants and new frontiers

The one-step and two-steps DME production processes are relatively well established, with a number of companies proposing the one-step (Topsoe, JFE Ho., Korea Gas Co., Air products, NKK) or two-steps (Toyo, MGC, Lurgi, Udhe) architecture[16].

Among the many applications for DME industrial production, the most interesting are listed below:

  • TOYO company has developed a indirect DME production catalyst and technology, fabricating a DME synthesis plant able to be installed in methanol production plant. The high performance MRF-Z® reactor[17], which has the features of multi-stage indirect cooling and a radial flow to the methanol synthesis unit, has a capacity up to 6,000 ton/day in a single train.
  • The MegaDME process is a combination of Lurgi MegaMethanol (capacity > 5000 tons/d)[18] and a Dehydration Plant.
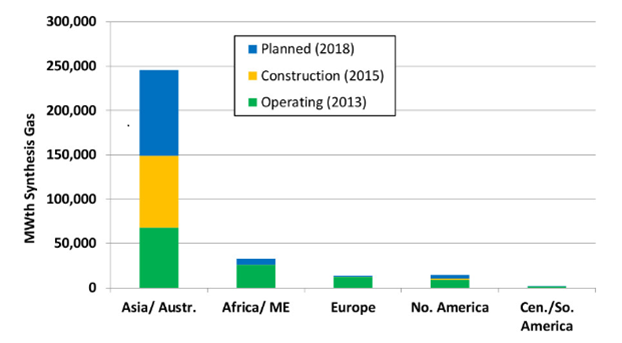
  • China is the world leader of DME production and use. Currently, there are various DME to Olefins and DME to Propylene facilities in China, while many other projects are advancing toward completion. Fourteen to fifteen facilities are expected to be operational by 2016. Most of them are based on the double-function catalyst developed by the Dalian Institute of Chemical Physics (DICP) for the one-step process[19].
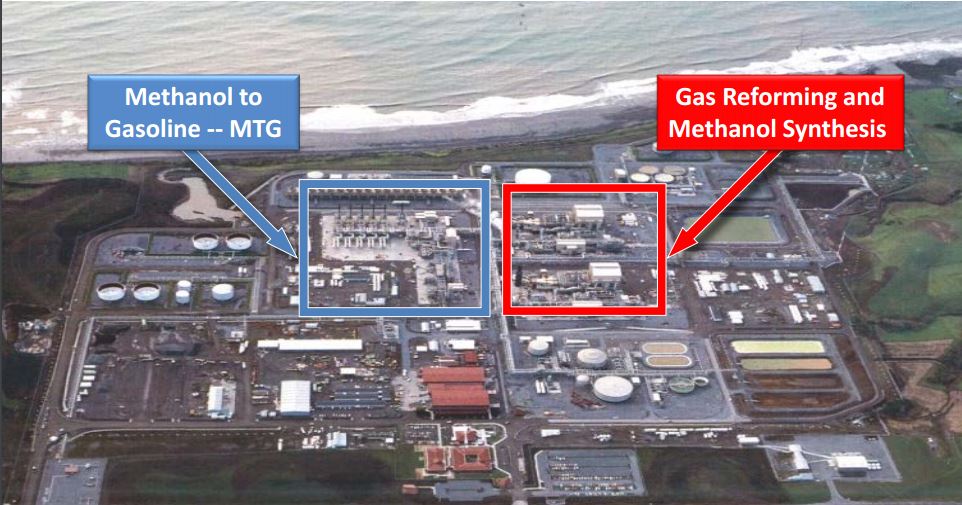
  • Methanol-to-Gasoline (MTG) is also an emerging demand segment. Today, six plants use the ExxonMobil’s MTG two-steps technology, with DME as intermediate[20]. In the figure below, the New Zealand SynFuel MTG plant is shown.

fig.20

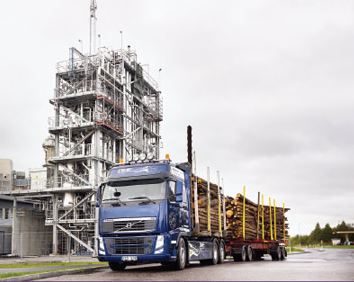
  • In Piteå (Sweden), a bio-DME demonstration plant is located. It started the operation in 2010 and it is based on the black liquor (a high-energy residual product of chemical paper and pulp manufacture) gasification process, able to produce a high-quality syngas which then is fed to a DME synthesis unit. The DME produced is, therefore, derived from a renewable energy source (refer to the following figure[21]).

fig.21

  • Fuel DME Production Co, a company of Mitsubishi Gas Chemical, has fabricated a DME production plant in Niigata Factory (Japan), with a capacity of 240 tons/day and which is fed by a methanol stream transported by pipelines (refer to figure [22]).

fig.22

The new research studies on the DME production process are mainly based on:

  • the testing and validation of more efficient catalyst for one-step process[23];
  • new reactor configurations as slurry reactors[24] and membrane reactors[25];
  • efficient distillation processes as dividing-wall column (DWC) technology and reactive distillation (RD) for DME purification[26].

[1] http://www.aboutdme.org/
[2] T.H. Fleisch, A. Basu, R.A. Sills, Introduction and advancement of a new clean global fuel: The status of DME developments in China and beyond. J. Natural Gas Science and Eng. 9 (2012) 94-107.
[3] S.H. Park, C.S. Lee, Applicability of dimethyl ether (DME) in a compression ignition engine as an alternative fuel. Energy Conv. and Management 86 (2014) 848-863.
[4] P. Tian, Y. Wei, M. Ye, Z. Liu, Methanol to Olefins (MTO): From Fundamentals to Commercialization,. ACS Catal. 5 (2015) 1922-1938.
[5] http://www.marketsandmarkets.com/PressReleases/dimethyl-ether.asp
[6] M. Migliori, A. Aloise, E. Catizzone, G.Giordano, Kinetic Analysis of Methanol to Dimethyl Ether Reaction over H-MFI Catalyst. Ind. Eng. Chem. Res. 53 (2014) 14885-14891
[7] E. Peral, M. Martín, Optimal Production of Dimethyl Ether from Switchgrass-Based Syngas via Direct Synthesis. Ind. Eng. Chem. Res. 54 (2015) 7465-7475.
[8] https://ec.europa.eu/research/energy/pdf/38_jie_chang_en.pdf
[9] http://www.biochar-international.org/node/6235
[10] C. Ampelli, S. Perathoner, G. Centi, CO2 utilization: an enabling element to move to a resource-and energy-efficient chemical and fuel production. Phil. Trans. Royal Soc. London A: Math., Phys. and Eng. Sciences 373 (2015) 20140177.
[11] S. Perathoner, G. Centi, CO2 recycling: a key strategy to introduce green energy in the chemical production chain. ChemSusChem 7 (2014) 1274-1282.
[12] F. Pontzen, W. Liebner, V. Gronemann, M. Rothaemel, B. Ahlers, CO2-based methanol and DME – Efficient technologies for industrial scale production. Catal. Today 171 (2011) 242-250.
[13] G. Centi, S. Perathoner, S. Advances in Catalysts and Processes for Methanol Synthesis from CO2, In: CO2: A valuable source of carbon. M. De Falco, G. Iaquaniello, G. Centi (Ed.s), Springer-Verlag London 2013, Ch. 9, p. 147-169.
[14] N. Diban, A.M. Urtiaga, I. Ortiz, J. Ereña, J. Bilbao, A.T. Aguayo, Influence of the membrane properties on the catalytic production of dimethyl ether with in situ water removal for the successful capture of CO2. Chem. Eng. J. 234 (2013) 140-148.
[15] I. Iliuta, F. Larachi, P. Fongarland, Dimethyl Ether Synthesis with in situ H2O Removal in Fixed-Bed Membrane Reactor: Model and Simulations. Ind Eng. Chem. Res. 49 (2010) 6870-6877.
[16] Z. Azizi, M. Rezaeimanesh, T. Tohidian, M.R. Rahimpour, Dimethyl ether: A review of technologies and production challenges. Chem. Eng. and Proc. 82 (2014) 150-172.
[17] http://www.toyo-eng.com/jp/en/products/energy/dme/
[18] http://www.ivt.ntnu.no/ept/fag/tep4215/innhold/LNG%20Conferences/2005/SDS_TIF/050140.pdf
[19] http://link.springer.com/article/10.1007%2Fs10562-005-9191-6
[20] http://cdn.exxonmobil.com/~/media/global/files/catalyst-and-licensing/2014-1551-mtg-gtl.pdf
[21] http://www.biofuelstp.eu/factsheets/dme-fact-sheet.html
[22] http://aboutdme.org/aboutdme/files/cclibraryfiles/filename/000000001968/7asiandme_fdme_ishiwada.pdf
[23] http://brage.bibsys.no/xmlui/handle/11250/2366817
[24] http://www.jenergychem.org/fileup/PDF/2003-04-0219.pdf
[25] F. Samimi, M. Bayat, D. Karimipourfard, M.R. Rahimpour, , P. Keshavarz, A novel axial-flow spherical packed-bed membrane reactor for dimethyl ether synthesis: Simulation and optimization. Journal of Natural Gas Science and Engineering 13 (2013) 42-51.
[26] http://www.aidic.it/cet/13/35/015.pdf


Enriched Methane Production Technologies

Author: Marcello De Falco – Associate Professor,University  UCBM – Rome (Italy)


1. Theme description

The Enriched Methane (EM) is a blend composed by Hydrogen and Methane which can be fed, if the H2 content is lower than 30% vol., into conventional natural gas internal combustion engines with a series of benefits in terms of [1] [2][3][4] :

  • improvement of engine energy efficiency;
  • reduction of CO2, CO, unburned hydrocarbons emissions.

The EM can be distributed in the low-medium natural gas grid (if the hydrogen composition is lower than 20% vol. [5] )and stored by using conventional methane storage system, thus its application being competitive using available and low cost infrastructures. Moreover, since hydrogen has the highest mass lower heating value (kJ/kg), the blend’s heating value is greater than those of the methane itself, thus enriching the energy contents.

Basically, if H2 is produced by exploiting a renewable energy source (solar, wind, biomass), the EM is a sort of a hybrid energy vector (fossil + renewable) with a immediate and competitive potentiality to be applied and a reduced environmental impact due to the strong reduction of CO2 emissions (up to 11% wt. if a blend of 30% vol H2 is burned).

In the present article, the main routes to produce EM blends are investigated both from fossil fuel and from renewable energies. Then, some applications implemented worldwide are presented.

2. Production Processes

2.1 Enriched Methane production from Fossil Fuels

Natural gas steam reforming is the most used process for the massive production of hydrogen. The process is composed by the following reactions:

fomule

and it is strongly endothermic, thus requiring high temperature to achieve high conversion of methane (90% at 850-950°C). In the conventional process, the reactions occur in tubular catalytic reactors placed inside furnace where a share of natural gas (30% approx) is burned to supply the reactions heat duty. But, if a EM stream has to be produced, much lower methane conversion (< 20%) and, consequently, lower operating temperatures (450-500°C) are required to reach the hydrogen content specifics. The main consequence is that the lower thermal level can be targeted concentrating solar radiation by well-know technologies as the Concentrating Solar Power (CSP) developed by ENEA, able to heat up a molten salt stream up to 550°C, reaching a thermal level suitable for the process requirements [6]. By this way, the hydrogen is produced exploiting a renewable source, improving the environmental footprint. The following figure shows a conceptual block scheme of the technology: after the low temperature reforming, a water gas shift reactor is installed to allow the conversion of CO into H2 and CO2; then the unreacted steam water is removed by condensation and the CO2 by an ammine-based absorption, while the EM stream is sent to the application.

fig1

A variation of the process is the Partial Oxidation Methane Reforming, where the heat duty is supplied thanks to the combustion of a share of input methane directly inside the adiabatic reactor. By this way, the energy needed to produce the hydrogen is fed by a fossil source.

Another process is the coal gasification, able to produce syngas (a mixture of methane, carbon monoxide, hydrogen, carbon dioxide and water vapor) from coal and water, air and/or oxygen. After the gasification reactor, a proper purification system allows to obtain a EM stream with the desired H2 composition.

2.2 Enriched Methane production from Renewable Electricity

Hydrogen can be produced from electricity by means of electrolyzers [7], which are able to dissociate the water molecule into hydrogen and oxygen. The electricity can be produced by renewable power plants as solar photovoltaic, wind farms, hydroelectric plants, etc., so that the hydrogen produced is completely CO2-free. Then, mixing the hydrogen with a methane stream, the EM blend is obtained and can be distributed by means of the natural gas grid. The following figure shows the renewable EM plant configuration.

By this architecture, it is possible to convert renewable electricity surplus into a high-added value product as EM, mitigating the intermittent nature of the renewable energy and avoiding overloading of the electricity network.

fig2

2.3 Enriched Methane production from Biologic Processes

The biological hydrogen production by photosynthetic bacteria, algae or fermentative microorganism appears to be a promising alternative to produce EM.

In anaerobic digestion process different microorganisms are involved to produce methane from complex biomass (as food wastes, organic fraction of municipal solid waste, agro-industrial waste, algae, etc.) through four steps: hydrolysis, acidogenesis, acetogenesis and methanogenesis [8].

To produce EM, a two-phase processes has to be implemented, by which an appropriate separation of acidogenic and methanogenic phases allows to convert the complex organic material into hydrogen, carbon dioxide and volatile fatty acids during the first stage, and then a conversion of these biodegradable compounds into methane and carbon dioxide during the methanogenic stage.

Moreover, processes able to convert a biomass (solid or liquid) into syngas (CO + H2), as the gasification, can be applied to produce EM. The gasificator can be coupled with a water gas shift reactor where the following reaction is promoted:

fomule 2

producing hydrogen from carbon monoxide. Then, the hydrogen is purified from CO2 and the trace of CO, mixed with methane and used.

3.Applications

Some EM pilot applications have been implemented worldwide. Among them, the following have to be cited:

  • Mhybus Project [9]: a EM-fuelled bus has been developed and circulated on urban roads in the city of Ravenna. The bus ran for more than 45,000 km on a normal service line, with an average of 212 km per day and more than 10.000 passengers on board, attesting the EM application feasibility. A yearly saving of 419 € for each bus using EM instead of natural gas has been quantified.

fig3

  • ALT-HY-TUDE Project tested two bused fuelled by Hythane® (a mixture of 20%vol H2 and 80%vol CH4) in the city of Dunkerque [10]. The project has been lead by the Research Division of Gaz de France. The hydrogen is produced by an electrolyzer in a specific filling station and then it is mixed with hydrogen to be fuelled in the bus with a natural gas conventional storage system.

fig4bis

  • METISOL was a research project, funded by a consortium lead by Centro Ricerche FIAT (CRF), focused on the development of a EM production plant coupled with a concentrating solar power plant (CSP). Hydrogen is produced a low temperature steam reformer (500°C) and a pilot plant able to generate 1 Nm3/h of EM (30% vol. H2) has been installed and tested in ENEA laboratories [11].

fig5bis

  • Malmö Hydrogen and CNG/Hydrogen filling station. A hydrogen production plant, connected with a EM filling station and composed by an electrolyzer, has been located in Malmö (Sweden) [12]. The filling station is owned and operated by E.ON Gas Sverige AB. The EM produced (8% vol H2) feeds two local buses, which have been tested for more than 3 years.

fig6

_______________________________________________________________

[1] Bauer CG, Forest TW. Effect of hydrogen addition on the performance of methane-fueled vehicles. Part I: effect of S.I. engine performance. International Journal of Hydrogen Energy 2001;26:55–70.
[2] Bauer CG, Forest TW. Effect of hydrogen addition on the performance of methane-fueled vehicles. Part II: driven cycle simulations. International Journal of Hydrogen Energy 2001; 26:71–90.
[3] Orhan Akansu S, Dulger Z, Kaharaman N, Veziroglu TN. Internal combustion engines fuelled by natural gas–hydrogen mixtures. International Journal of Hydrogen Energy 2004;29:1527–39.
[4] Ortenzi F, Chiesa M, Scarcelli R, Pede G. Experimental tests of blends of hydrogen and natural gas in light-duty vehicles. International Journal of Hydrogen Energy 2008;33:3225–9.
[5] Haeseldonckx D, D’haeseleer W. The use of natural-gas pipeline infrastructure for hydrogen transport in a changing market structure. International Journal of Hydrogen Energy 2007;32:1381–6.
[6] De Falco M, Giaconia A, Marrelli L, Tarquini P, Grena R, Caputo G. Enriched methane production using solar energy: an assessment of plant performance. International Journal of Hydrogen Energy 2009; 34: 98-109.
[7] http://www.nrel.gov/docs/fy04osti/36705.pdf
[8] Cavinato C , Bolzonella D, Fatone F, Cecchi F, Pavana P. Optimization of two-phase thermophilic anaerobic digestion of biowaste for hydrogen and methane production through reject water recirculation. Bioresource Technology 2011;102:8605–8611.
[9] http://community.aster.it/mhybus/en/mhybus_en.htm
[10] http://www.althytude.info/fileadmin/user_upload/documents/triptyque.pdf
[11] http://link.springer.com/chapter/10.1007/978-3-319-22192-2_3
[12] http://www.cder.dz/A2H2/Medias/Download/Proc%20PDF/PARALLEL%20SESSIONS/%5BS26%5D%20 Deployment/13-06-06/339.pdf


Environmental Monitoring in Offshore Oil&Gas Industry

Author: Vincenzo Piemonte, Associate Professor, University UCBM – Rome (Italy) 


1. Theme description

The global environmental situation of the Earth is becoming increasingly problematic and critical. The outlook for our future is increasingly gloomy. The major reason for this pessimistic outlook is the exploding number of people. At the same time, the consumption per person has risen tremendously in the developed countries. There is no doubt that the Earth will not be able to satisfy such increasing demand. Because of the developments described above, radical changes to the global situation and especially to the ecology are ahead. Air pollution, the greenhouse effect, and the noticeable impact of both on coastal areas, especially in the Third World, represent of course important critical points.

Today, the opportunity has fallen to us that we can try to get the necessary information on the overall situation by means of modern remote sensing methods. The advantage of this kind of environmental data supply is that information is obtained worldwide by a single standard, and at regular, short intervals, applying comparable measures. These aspects of regularity and comparability offer great potential because they provide the possibility of producing “snapshots” of the environmental situation at regular intervals.

From a general point of view, environmental monitoring can be defined as the systematic sampling of air, water, soil, and biota in order to observe and study the environment, as well as to derive knowledge from this process [1], [2]. Monitoring can be conducted for a number of purposes, including to establish environmental “baselines, trends, and cumulative effects”, to test environmental modeling processes, to educate the public about environmental conditions, to inform policy design and decision-making, to ensure compliance with environmental regulations, to assess the effects of anthropogenic influences, or to conduct an inventory of natural resources [3].

Environmental monitoring can be conducted on biotic and abiotic components of any of Earth spheres (see figure 1), and can be helpful in detecting baseline patterns and patterns of change in the inter and intra process relationships among and within these spheres. The interrelated processes that occur among the five spheres are characterized as physical, chemical, and biological processes. The sampling of air, water, and soil through environmental monitoring can produce data that can be used to understand the state and composition of the environment and its processes.

Environmental monitoring uses a variety of equipment and techniques depending on the focus of the monitoring. For example, surface water quality monitoring can be measured using remotely deployed instruments, handheld in-situ instruments, or through the application of biomonitoring in assessing the benthic macro invertebrate community [4]. In addition to techniques and instruments that are used during field work, remote sensing and satellite imagery can also be used to monitor larger scale parameters such as air pollution plumes or global sea surface temperatures.

Immagine1

Figure 1 – The five spheres of the Earth System [5]


2. Environmental monitoring applied to offshore Oil&Gas platforms

When conducting oil and gas operations, there is a risk of impacting the marine environment. Generally, environmental authorities set up guidelines to monitor the environmental conditions around oil and gas production platforms.

Using results from a long-term survey programme, it is normally assessed:

  • the environmental state around the platforms compared with a reference station
  • spatial and temporal changes in the environmental state of the seabed around the platform

As part of the monitoring surveys, several samples of sediment (see figure 2) at different monitoring stations can be collected in order to carry out:

  • physical and chemical analyses
  • the identification and quantification of benthic fauna

Physical and chemical analyses on the samples can include:

  • grain size analysis and determination of the median grain size and the silt/clay fraction of the sediment
  • dry matter, loss on ignition and total organic carbon
  • metals – Barium (Ba), Cadmium (Cd), Chromium (Cr), Copper (Cu), Lead (Pb), Zinc (Zn), Mercury (Hg) and Aluminium (Al)
  • total hydrocarbons and polycyclic aromatic hydrocarbons/ alkylated aromatic hydrocarbons (PAH/NPD)

Analyses of the collected benthic fauna can include:

  • species identification
  • biodiversity and abundance analyses
  • biomass of all major taxonomic groups (as total wet weight and total dry weight)
  • precisely determining the biomass of the brittle star Amphiura filiformis, which is known to be sensitive to drilling activities
 Immagine2
Figure 2 – Sediment samples being collected around platforms using a HAPS core sampler


Statistical analyses and available literature can be also used to evaluate the environmental state around the platforms.

Generally, to ensure high quality of collected results, all procedures complied with relevant international Health, Safety and Environmental (HSE) standards and with the requirements of local environmental authorities. This included performing the survey in accordance with respect to the:

  • number of samples taken
  • analyses of samples for certain physical, chemical and biological variables


3. An Example of application: UK, Netherlands and Norway case studies [6]

Monitoring activities have been performed in all three countries to look at effects of discharges in the sediments and in the water column. Effects on migrating birds of flaring and light from offshore installations has been monitored at the Dutch Continental Shelf and studies on the effects of seismic activity on fish and marine mammals have been performed on the Norwegian Continental Shelf. An overview of the performed monitoring activities in the United Kingdom, the Netherlands and Norway are given in Tables 1, 2 and 3.

Monitoring of sediments contaminated by discharges of oil-based muds (OBM) has shown that the benthic communities close to the discharge points have been highly modified, and with a transitional zone with detectable effects on benthic fauna and an outer zone with no detectable effects on the fauna. This is shown in all three countries. The areas contaminated with OBM are decreasing and so are the benthic effects. The Dutch study found biological effects out to 250 meters from the discharge point 20 years after the discharge. The latest data from Norway show a total contaminated area of 155 km2 on the Norwegian Continental Shelf. This is chemical contamination and not biological disturbance and the area also includes sites where OBM has never been operationally discharged. Hydrocarbon contamination at these sites may be caused by produced water or accidental spills.

The Dutch study on effects of discharge of water-based muds (WBM) cuttings showed no detectable effect on the benthic community. Norwegian monitoring and one-off surveys have shown a disturbance of the fauna typically out to approximately 50 meters from single wells. The disturbance is most likely caused by the physical impact of the cuttings, and species living in or on the sediment dies. However, a rapid colonization is observed, but the composition of species may change if the grain size is changed. In areas with several production wells the area affected is larger and effects may be caused by other discharges than WBM and cuttings.

Results from Norwegian water column monitoring in the last few years show positive results in the sense that the methods used are now functioning. It is crucial to know enough about how the plume of produced water is mowing to be able to place the cages with test species at the right spots. The results show that caged mussels in the effluent accumulate PAH and that the levels decrease with increasing distance from the discharge.

The biological effects (biomarkers) also show gradients with stronger responses in the cages closest to the produced water discharge. The levels of PAH-metabolites suggest a moderate exposure level. The Dutch study showed an accumulation of naphthalene in blue mussel in a distance of 1000 meters from the platform. The analyses of wild fish in the Norwegian Tampen area have shown increased levels of DNA-adducts in haddocks. A different lipid content or lipid composition of the cell membranes has been shown in cod and haddock from the Tampen area compared to other areas in the North Sea. These effects may be due to the fish feeding on old cuttings piles, and are not necessarily a result of today’s produced water discharges. It is, however, not concluded what these findings mean for the individual fish, the populations or the ecosystems as such.

Other monitoring activities or studies than the monitoring of impacts of discharged have also been performed by the three countries. The Dutch study on birds suggests that the chance that flaring directly impacts a flock of birds is small and only significant at night during the migration periods.


Table 1 –  Sediment monitoring

Immagine3

Table 2 – Water column monitoring

Immagine4

Table 3 – Other monitoring activities

Immagine5


Sound did not appear to have any affect on seabirds or songbirds during migration. But the study calculates that about 10 % of the total bird population crossing the North Sea is impacted in some way by the light emitted from the main deck at offshore installations. The Norwegian study on impacts of seismic surveys on fish showed that impacts (including mortality) on fish and their early life stages only occurred immediately adjacent (< 5 metres) to the sound source. This impact was not significant at the population level and did not affect recruitment into commercial stocks. Fish show a startle response to impulsive sound and the effect may be observed up to 30 km from the source.

________________________

[1] Artiola, J.F., Pepper, I.L., Brusseau, M. (Eds.). (2004). Environmental Monitoring and Characterization. Burlington, MA: Elsevier Academic Press.
[2] Wiersma, G.B. (Ed.) (2004). Environmental Monitoring. Boca Raton, FLA: CRC Press.
[3] Mitchell, B. (2002). Resource and Environmental Management (2nd ed.). Harlow: Pearson
[4] The Community-Based Environmental Monitoring Network (CBEMN). (2010). The Environmental Stewardship Equipment Bank.
[5] De Blij, H.J., Muller, P.O., Williams, R.S., Conrad, C., Long, P. (2005). Physical Geography: the Global Environment. Don Mills, ONT: Oxford University Press.
[6] An Overview of Monitoring Results in the United Kingdom, the Netherlands and Norway, OSPAR Commission, 2007


Particulate Emission & Removal Technologies

Author: Mauro Capocelli, Researcher, University UCBM – Rome (Italy)


1. Theme description

Particulate matter (PM) is a complex mixture of micrometric particles and liquid droplets made up of organic soot (VOCs) as well as inorganic particles as soil, dust, metals and acids (nitrates and sulphates). The particle size, fundamental for the transport as well as the health effects, is usually classified by the aerodynamic diameter, the size of a unit-density sphere with equivalent aerodynamic characteristics (Figure 1). This size can vary over four orders of magnitude in the atmosphere; the largest ones (coarse fraction), mechanically produced, include pollen grains, mould spores, wind-blown dust from agricultural processes, sea spray, uncovered soil, unpaved roads or mining operations; the smallest ones (fine fraction) are mainly formed from gases by nucleation and coagulation at a scale lower than 0.1-1 μm (accumulation range). Moreover, secondary aerosol can be formed by chemical and physical reactions in the atmosphere as acidic forms (from sulphuric and nitric acid) and ammonium salts (in the presence of ammonia). The carbonaceous fraction of aerosols is composed by organic matter (either primary or secondary if deriving from the oxidation of VOCs) and elemental carbon (EC, also known as black carbon, BC).

Immagine1

Fig. 1 – Size distribution of particulate matter


Sources and effects
Figure 2 represents the contribution of PM pollution from different sectors and activities in european countries. The particles produced by combustion processes represent the largest portion of the anthropogenic sources. Large stationary sources are related to the Power Generation and, in minor part, directly to the oil & gas industry. The major exposure risks are related to domestic heating while transport (urban traffic and emission of the diesel engines of harboured vessels) is the second relevant source inhabited areas. Gas flaring is recognized as an important source of pollution, even though limited to specific zones [1]. The uncontrolled gas flaring can generate emissions of unburned hydrocarbons, particulates and polycyclic aromatic hydrocarbons (PAH). Every year, approximately 140-150 billion cubic meters of natural gas is flared into the atmosphere (equivalent to three quarters of Russia’s gas exports, or almost one third of the European Union’s gas consumption [2]). In 2011 Johnson et al., measured the soot emission from a large gas flare in Uzbekistan; they highlighted a potentially dramatic environmental impact of gas flaring, calculating a soot emission rate of 7400 g/h comparable to ∼500 buses constantly driving and estimable in 275 trillion soot aggregates per second [3].

Immagine2


Immagine3

Fig. 2 – Sector contributions of emissions of primary particulate matter and secondary precursors in EEA member countries [4]


Exposure to particulate matter is associated to serious health effects as respiratory and cardiovascular disease depending on the specific particle size, morphology and composition. The PM size is directly linked to the damaging potential: very fine inhalable particles remain suspended in the atmosphere for a long time traveling long distances from the emitting sources and, once inhaled, reach the deepest regions of the lungs entering in the circulatory system. Generally, the lower is the particle size (and the higher specific area), the higher is its toxicity, also due to absorption of pollutants affecting human health with specific actions (carcinogen and mutagen compounds). Heart attacks with associated premature death, irregular heartbeat, asthma, decreased lung function, and several respiratory symptoms, such as irritation of the airways, coughing or difficulty breathing are among the PM exposure recognized issues [5]. PM pollution is estimated to cause more than 50000 deaths per year in the United States and 200,000 deaths per year in Europe [6]. Fine particles impact extended ecosystems by traveling over long distance, reducing the visibility, polluting ground and surface waters as well as acting on the climate changes and global warming (BC is the second most important climate warming agent after CO2, having a radiative index of 1.1 W/m2). An other climate effect is the cloud formation since they act as water condensation nuclei [5].


2. Removal technologies

The removal technologies utilizes different strategies to separate solid particles from the flowing gas: to intercept particles by acting on the particle size and shape (filtration and scrubbing); to exploit external force fields such as gravitational, electrical and centrifugal.

Filtration
In a Fabric Filter (FF), waste gas is forced to pass through a tightly woven or felted fabric, collecting particulate matter on the fabric by sieving and other related mechanisms. Fabric filters can be in the form of sheets, cartridges or bags (the most common type) with a number of the individual filtering units housed together in a group. When low particles loads occur, filter collection efficiency is primary related to the filter pore size and length. High particulate loading forms a “cake” on the filter surface increasing the collection efficiency.
Fabric filters are used, primarily, to remove particulate matter (and other hazardous air pollutants in particulate form such as metals) at moderate loads (and gas flow rate limit of 2•106 Nm3/h) down to PM2.5. This technology is useful to collect particulate matter with electrical resistivity either too low or too high for Electrostatic Precipitator, so they are suitable to collect fly ash from low-sulphur coal or fly ash containing high levels of unburnt carbon [7]. The cleaning intensity and frequency are important variables in determining removal efficiency (the dust cake provides an increased fine particulate removal) and the pressure drop across the fabrics (ΔP 100-500 mbar) and the consequent energy requirement (0.2-2 kWh/1000Nm3). Catalytic filtration is commonly adopted in the new generation of diesel particulate filters, DPF, for the automotive application. Commonly the oxidation catalyst and the particulate filter are combined and particles can be burnt off continually. The catalyst filter consists of an expanded polytetrafluoroethene membrane, laminated to a catalytic felt substrate. It is used to separate particulate and eliminate hazardous contaminants from the gaseous phase, such as dioxins and furans, but also aromatics, polychlorinated benzenes, polychlorinated biphenyls, volatile organic compounds and chlorinated phenols. The filtration efficiencies of DPF is > 99% for solid matter (globally > 90% considering a non-solid portion). These systems can be alternatively designed to trap a portion of the total particle load (e.g. the 70% instead of the 100%) in order to obtain a lower back pressure and a blocking risk.

Gravity and Centrifugal force
Larger particles can be removed from flue gas by exploiting gravity/mass inertia and internal obstructions. A separator chamber can be installed as a preliminary step to prevent entrainment of the washing liquid with the purified waste gas and/or to remove dust, aerosols and droplets. Also abrasive particles can be treated in order to preserve the downstream equipment. The separation occurs by impact with properly designed internal surfaces, like baffles, lamellae or metal gauzes. The main advantages of separators are the suitability for higher temperatures as well as the lack of moving parts, which determines low maintenance and low pressure drop. On the contrary, the low removal efficiency makes it unsuitable for systems with small density differences between gas and particles. By exploiting centrifugal forces, the separation can be achieved through cyclones. In a purposely designed conical chamber, the incoming gas is forced into circular motion down the cyclone near the inner surface of the cyclone tube. Particles in the gas stream are forced toward the cyclone walls by the centrifugal force of the spinning gas; the larger ones, reaching the cyclone walls, fall down in a bottom hopper where are collected. These simple devices are used to primarily control particles over PM10 (pre-cleaners for more expensive final control devices such as fabric filters or electrostatic precipitators); high efficiency cyclones can be designed to be effective even for PM2.5. The main advances of classical separation chambers are kept in these conical arrangements.

Wet Scrubbing
Wet scrubbers (WS) realize the interception of PM through the direct contact with liquid droplets. WS can assembled with variable geometries to each of which optimized in a specific gas flow rate; in relation to the contact dynamics they are arranged in the form of spray towers, packed bed scrubber and Venturi scrubbers (Figure 3). This last realizes the acceleration of the gas stream in a throat to atomize the scrubbing liquid and to improve gas-liquid contact (Figure 3).


Immagine4

Fig. 3 – Schematic of a Venturi Wet Scrubber [8]

Liquid scrubbers are used in case of removal/recover of flammable and explosive dusts as well as treatment of gaseous compounds. Furthermore, WS as the advantage to cool and supersaturate the gas stream leading to particle scrubbing by condensation. WS can operate at medium/high collection efficiency and low cost. On the other hand, the main disadvantages of WS are the risk of corrosion and freezing, the generation of a liquid by-product and the low particle collection efficiency in the 0.1-2µm range.

Electrostatic force
The Electrostatic precipitator (ESP) utilizes electrical forces to move particles in gas streams into collector plates. It can be “wire-plate” if gas flows horizontally and parallel to vertical plates of sheet material and wire-pipe if the electrodes are long wires running through the axis of each tube. The entrained particles acquire an electrical charge passing through a corona field generated by discharge electrodes (DC voltage required in the range of 20-100kV). ESP has high efficiency and low pressure drop. Main disadvantages are related to the maintenance of the high voltage generation (electrodes cleaning) as well as the danger of dust explosion after discharges. In 2006 Javorek et al.[9], have realized a comprehensive review of the wet ESP state-of-the-art for gas cleaning (mainly dust or smoke particles). In a single stage ESP, the charging and discharging (collecting at the electrode) take place in one device while in a two stage ESP, charging and removal of the particles occur in separate electric fields (and consequently separate chambers). The two stage ESP is common for small waste gas streams (<90000 Nm3/h) characterized by a high concentration of micrometric and sub-micrometric particles (e.g. smoke or oil mist). EPA gives a detailed overview of ESP types, configurations and designing procedure [10].


3. Innovative technologies

The more stringent environmental evidences and the recent emission regulations are forcing the development of more effective gas cleaning technologies (particularly effective in the submicronic sizes). The existing technologies have low efficiency in the particle diameter range 0.01-1µm, called Greenfield gap region . As aforementioned, the capture of the particulate matter is usually carried out by fabric filters and electrostatic precipitators, which are the actual best available technologies. However, these units shown limited efficiency in capturing particles of submicron or nanometres size. Moreover, the ESP technology is ineffective for particle resistivity out of the range 108-1011Ωcm and for gas streams containing water droplets. On the other hand, FF cannot be used if the water content in the flue gas can produce condense on the cake deposited on the bags. Therefore, a new challenge of the scientific research is the development of new cleaning systems to remove particles from flue gas and the optimization of the existing technologies in order to improve the particle capture of submicronic particles [11]. An example is the research activity in the field of diesel particulate abatement where several strategies are under development, particularly in the ship emission context. As the emissions from diesel ship engine represent an emerging issue, the International Maritime Organization has enforced the environmental regulations. A consortium of European Universities and Industrial Partners developed a modular on-board process combining different units to remove specific primary pollutants (SOx, NOx, PM and VOC) participating to the European Seventh Framework Programm [12]. The PM removal technology, developed by The University of Naples consisted in an innovative upgrade of a wet scrubbing device . In fact, the Wet electrostatic Scrubber (WES) increases the scrubber collection efficiency by sweeping the precipitation chamber with charged droplets. These act as small collectors attracting the particles due to Coulomb force. A practical example of this phenomena is the scavenging of atmospheric aerosol during thunderstorms with the achievement of highest removal efficiency [13]. Different charging and spraying configurations are possible and PM can be charged either negatively or positively with opposite polarity droplets. A commercial application of this interesting technology is the Cloud Chamber Scrubber (CCS) by Tri-Mer Corporation (Figure 4) [14]. It is composed of three zones: preconditioning chamber (A) for the removal of coarse particles and humidity/temperature adjustment; cloud generation vessel (B) for the removal of neutral and negative submicronic particles; second cloud generation vessel (C) with negatively charged droplets so that neutral and positive particles are captured. Afterwards treated air flows through a mist eliminator, before discharge (particles between 0.1 and 2.5 µm).

Immagine5

Fig. 4 – Layout of the Cloud Chamber Scrubber [14]


___________________________

[1] Journal of Environmental Protection, 2011, 2, 1341-1346
[2] http://www.resilience.org/stories/2013-09-03/gas-flaring-the-burning-issue
[3] Environ. Sci. Technol. 2011, 45, 345–350
[4] European Environmental Agency: http://www.eea.europa.eu/data-and-maps/figures/sector-contributions-of-emissions-of-2.
[5] D’Addio, L., 2011. PhD Dissertation. Wet electrostatic scrubbing for high efficiency submicron particle capture.
[6] Mokdad, Ali H., et al. 2004. “Actual Causes of Death in the United States, 2000.” J. Amer. Med. Assoc. 291:10:1238
[7] D’Addio, L., 2011. PhD Dissertation. Wet electrostatic scrubbing for high efficiency submicron particle capture.
[8] http://www.mecasiapacific.co.th/Venturi-scrubber.html
[9] Javorek et al., 2006. Environmental Science & Technology 9 Vol. 40, No. 20
[10] www.epa.gov/ttncatc1/dir1/cs6ch3.pdf
[11] M. Giavazzi, L. D’Addio, F. Di Natale, C. Carotenuto, A. Lancia New technologies for the removal of submicron particles in industrial flue gases. Aprile 2014
[12] http://www.deecon.eu/index.html Di Natale et al., Capture of fine and ultrafine particles in a wet electrostatic scrubber. Journal of Environmental Chemical Engineering 03/2015; 3(1). DOI: 10.1016/j.jece.2014.11.007
[13] Di Natale et al., 2012. New Technologies for Marine Diesel Engine Emission Control Chemical Engineering Transactions 01/2013; 32(2012):361-366 D’Addio et al., A lab-scale system to study submicron particles removal in wet electrostatic scrubbers Chemical Engineering Science 06/2013; 97:176–185.
[14] http://www.tri-mer.com/wet_scrubber.html


Nanotechnology in Oil Industry

Author: Andrea Milioni – Chemical Engineer – on Cooperator Contract – University UCBM – Rome (Italy)


1. Theme description

The enhancement in nanoscale-structured materials represents one of the most interesting innovative aspects bringing technological advances in many industries. Nanoparticle technology developments essentially concern materials engineering with the possibility of new metallic alloys ensuring high strength, low weight and high resistance to corrosion and abrasion. However, these materials can appear in different forms, from solid to fluid, with the possibility to have ad hoc nanoparticle-fluid combinations.

The upstream oil & gas industry could receive a great boost under the impulse of innovations in this field being based on processes exposing the equipment materials to extreme work conditions. Moreover, the developments of nanotechnology associated with suitable simulation tools allow to characterize interfacial phenomena between minerals and fluids (wettability etc.), causing a better understanding of the mechanisms concerning recovery of hydrocarbons. Currently, the shale gas and oil production increases the need of nanotechnology enhancement to better characterise the organic content in shale nanopores.

Almost every oil & gas company is heavily investing in nanotechnologies to enhance oil recovery, to improve equipment reliability, to reduce energy losses during production, to provide real-time analytics on emulsion characteristics; to develop high-performance products (e.g. high performance lubricating oils have a great relevance in oil industry). In the following, some recent applications in these fields, will be described.


2. Enhancement in oil recovery

The use of nanoparticles in Enhanced Oil Recovery (EOR) is one of the most important fields of application as it provides larger amounts of oil during the extraction, thus ensuring a faster return on investment. Different techniques using nanotechnology are being considered and very promising appears to be the use of nano-robots for real time insight into the well pad. These tiny robots will be able to provide operators with useful information to better conduct the drilling operations, for example adapting the additive mixtures or the operating pressure dynamically. In the EXPEC Advanced Research Centre has been realized some important works about the use of nano-robots in oil & gas reservoirs designing reservoir robots (called Resbots) used as nano-reporters. The main difficulty lies in adapting the resbots physical and chemical properties in order to pass through the tiny pores and then to recover them, but some experiments brought good results [1]. By adding some sensors inside the robots, very important information will be obtained.

EOR could also be guaranteed by the use of nanoparticles dispersed in suitable fluids. Recently, Ogolo et al. [2] performed some EOR experiments using different nanoparticles like magnesium oxide, aluminium oxide, zinc oxide, zirconium oxide, tin oxide, iron oxide, nickel oxide, hydrophobic silicon oxide and silicon oxide treated with silane showing enhanced recovery and boosted hydrocarbon production. The effects resulting from the use of these substances are related to the change of rock wettability, reduction of oil viscosity, reduction of interfacial tension, reduction of mobility ratio and permeability alterations. A further example of using nanoparticles (in order to improve the oil recovery efficiency) as an additive during operations has been provided by University of Alaska Fairbanks [3] where some researchers highlighted the important performances guaranteed by the use of metal nanoparticles dispersed into supercritical CO2, responsible of  the heavy oil viscosity reduction with consequent increasing of recovery efficiency.


Immagine1

 Figure 1 – Chemical flooding method for Enhanced Oil Recovery [4]


3. Improvement in equipment reliability

One of the main problems in the oil & gas industry is the use of materials capable of withstanding highly corrosive environments. The use of sour crude is highlighting this problem, reducing the equipment lifetimes, particularly for pipelines and heat exchangers. The need to solve these problems has led to research in the field of nanotechnology, in order to develop nanostructured coatings able to increase the corrosion resistance. For example, Saudi Aramco, in collaboration with Integran [5], has  realized an important research in this field carrying out a product development program called “Application of Nanotechnology for In-Situ Structural Repair of Degraded Heat Exchangers”. The aim is therefore to develop products able to reduce the corrosion damage and the downtime due to maintenance. In aggressive environments with corrosion and high wear, the use of protective film is complex. Until few years ago electroplated “engineered hard chrome (EHC) was used for surface protection. EHC was preferred to Cadmium (Cd) or Zinc Nickel (ZnNi) electroplated metals because they offer low resistance to wear condition and are quickly removed. Highlighting the chrome toxicity which negatively affect workers, an overcome of EHC has been recently suggested. In this respect, Integran proposes electroplated nanocrystalline Cobalt, called Nanovate CoP which represents an innovative and cost effective overcoming of EHC. In figures 2-3-4 are shown the results of typical corrosion tests [6].


Immagine2

 Figure 2 – Time to red rust following NSS exposure (as per ASTM B117) for nCoP compared to Enduro Industries LLC’s ChromeRod and EHC from other industrial vendor

Immagine3

Figure 3 – ASTM B537 protection rating after 24hr CASS testing (as per ASTM B368) for nCoP compared to Enduro Industries LLC’s ChromeRod, industrial EHC vendor and multilayer Nickel/Chrome coatings

Immagine4

Figure 4: Time to failure in NSS following magnesium chloride testing for nCoP compared to industrial EHC vendor, nitrocarburized and multilayer Nickel/Chrome coatings.


4. Energy losses reduction

The heat loss during the operations for the oil & gas treatment is a very important problem. It has been estimated that about 50% of the supplied heat is lost in the equipment and this considerably lowers the process efficiency. Researches in this field are leading to the formulation of aerogel solutions that insulate the equipment surface. The use of nanotechnologies in this field is making a major contribution as proof by the realization of innovative products like Nansulate® by  Industrial Nanotech, Inc [7]. Nansulate® allows very low thermal conductivity through the use of nanocomposite called  Hydro-NM-Oxide mixed with acrylic resin and performance additives.

Immagine5

Table 1 – Experimental tests on Nansulate [8] 

Immagine6

Table 2 – Summary of lubrication properties of nanoparticles of different materials as additives


5. Providing real-time analytics on well characteristics

A possibility offered by nanoparticles concerns the real-time analysis of emulsions extracted from wells. This is due to the injection of nanoparticles, then recovered. One of the major companies in this field is MAST Inc. [9] which develops instruments to identify the spectroscopic characteristics of the particles during the extraction operations. The particles contain a magnetic core and are covered by sensitive substances which detected the presence of sulfur, water or gas content. The experience in magnetic sensors has led to the development of techniques to observe them also in a fully opaque stream.

The importance of this technology is growing rapidly after the intense use of fracking, which assures more resources and a new development in oil exploration. However, fracking can also cause significant environmental impacts and therefore requires considerable efforts related to environmental monitoring.  With this respect,  the use of nanosensors enables the development of techniques to preserve the purity of groundwater in the well proximity.

6. Use of nanoparticles for high-performance lubricant oils

The use of nanoparticles in addition to particular mixtures is bringing innovation in different industrial sector, allowing the development of new high-performance products which will positively influence the related industry. One of the most important innovation is offered by the use of a new generation of anti-wear lubricant oils. As shown in different works, experimental results prove remarkable improvements in the tribological behaviour (low wear and increased load-carrying capacity). The lubricant effect of different nanoparticles used as additives depends on material category and essentially concerns the properties of typical nanoparticle materials. These are summarized in table 2 and well described in Guo et al. 2013 [10].


[1] http://www.aramcoexpats.com/articles/2008/10/resbots-pass-first-reservoir-feasibility-tests/Table 5: Summary of lubrication properties of nanoparticles of different
[2] N.A. Ogolo et al. 2012, Enhanced Oil Recovery Using Nanoparticles, Society of Petroleum Engineers.
[3] Rusheet D. Shah 2009, Application of Nanoparticle Saturated Injectant Gases for EOR of Heavy Oils, Society of Petroleum Engineers.
[4] https://ugmsc.wordpress.com/2010/09/15/eor-enhanced-oil-recovery/
[5] http://www.integran.com
[6] http://www.integran.com/Portals/212577/documents/enduro%20iti%20paper%20-%20surfin%20final.pdf
[7] http://www.nansulate.com/
[8] http://www.nansulate.com/howworks/thermaldata1.jpg
[9] http://mastinc.com/
[10] Guo et al. 2013, J. Phys. D: Appl. Phys. 47 (2014) 013001


Industrial Lubricant Oils

Author: Andrea Milioni – Chemical Engineer – on Cooperator Contract – University UCBM – Rome (Italy)


1. Theme description

Lubricants are products used mainly in engines to reduce friction among mechanical bodies. Contrary to the majority of petroleum products which are identified through several parameters (the specs), lubricants are commonly identified only by their real performance, which can be tested only experimentally in specialized laboratories. The most important lubricants’ spec is the Viscosity Index (VI), a measure of viscosity variation at different temperatures.

Lubricants are a blend of “base oils” and several additives. Base oils are generally produced from crude oils, but could also be produced by petrochemical feed-stocks (synthetic lubs). Additives are chemicals produced by few oil companies and some chemical company focused on this field as Lubrizol. The effective lubs performance strictly depends on the additives mixture. Additives and base oils are normally commercialized on the market, so the majority of companies buy and blend them. Lubricants, after used (exhaust oils), may be collected and reprocessed in order to obtain “second-hand” marketable products. Lubricants are among the most sophisticated and the most technology-intensive products of refining. Given the lower demand with respect to other petroleum products they are produced only in a limited number of refineries.


2. Mineral Base Oils [1]

The mineral base oils quality strictly depends on the crude origin, also if it can be partially modified through refinery processes. The base oils are a mixture of hydrocarbons,  including alkanes (paraffins), alkenes (olefins), alicyclic (naphthenes), aromatics and some “mixed hydrocarbons” (where in one molecule are different  groups of the above molecules). Regarding the base oils production, the aromatics have a negative impact to the viscosity index. They also worsen the base oils characteristics, meanly increasing the deposit formations and reducing the oxidation resistance.

Over hydrocarbons base oils contain the non-hydrocarbon molecules normally present into crude oil. The main non-hydrocarbon components are sulphur, nitrogen and oxygen. The sulphur heterocyclics are the most abundant of them.

The base oils feed-stock is the vacuum heavy gas-oil and the following units are a solvent extraction to separated aromatics and a deparaffinization to extract heavy paraffines (waxes).

The solvent treatment may be replaced by hydrogen process, e. g. HDC, perfectly integrated and already present in some refinery. This allows good yields and excellent quality bases, although starting from a traditionally unsuitable crude. Figure 1 shows an integrated scheme for production of base oils, either through solvent extraction or through HDC. The process usually ends with a hydrofinishing unit which improves colour, stability, etc. Blending and additivation are the final steps.


Immagine1

 Figure 1 – Integrated cycle of base oil production in refinery (if hydrocracking process is available) [2]


Base oils cuts are internationally classified on the basis of viscosity SUS (Saybolt Universal Seconds) measured at  40 or 100 ° C (100 or 210 ° F). In addition, a code precedes the  SUS viscosity value, such as, for example, SN (solvent neutral) or HVI (High Viscosity Index). The abbreviation BS (Bright Stock) is used for heavier cuts produced by the deasphalted residue. The crudes most suitable for base oil production are paraffinic ones, characterized by a high viscosity index (VI), but also by a high wax content. For certain applications, naphthenic crudes are more suitable because of the high-quality middle and low VI, the reduced content of wax and the naturally low sliding points.

Paraffinic base oils

Paraffinic base oils arising from paraffinic crudes are the most widely used.

The characteristics of these base oils depend on the original hydrocarbons composition, as well as on the effect of solvent extraction and de-waxing processes. The paraffinic base oils viscosity index is generally greater than 95 and the pour point is relatively high.

The viscosity index is as higher as stricter is aromatic extraction. It is also possible to increase the index by decreasing the de-waxing strictness but in this case there will be a worsening of the low temperature property.

Naphthenic base oils

Naphthenic base oils are produced from a few crudes (typically from Venezuela) and are currently used in a few applications where low-temperature properties are required and the viscosity index is less important.

These base oils have better solvent power, but low resistance to oxidation than paraffinic ones. Generally, they are also characterised by a low viscosity index (between 40 and 80) and a relatively low pour point due to the absence of paraffins.


3. Synthetic base oils

Most of the synthetic bases has both higher VI and flash points but lower pour points compared to mineral ones. On this basis, these oils are particularly useful in extreme  temperature and pressure conditions.

The synthetic bases such as polyalphaolefins (PAO), alkylated aromatics, esters, polyglycols, polybutenes and  polyinternalolefins (PIO) are widely used in lubricants industry.

Polyalphaolefin (PAO)

Polyalphaolefins show very good characteristics when operating at cold temperatures thanks to the high branching and volatility degree. However in some oxidation tests they appear less resistant than mineral bases (in absence of additives). This behaviour is due to the absence of natural antioxidants, present in the mineral oils. PAOs are less polar and thus they have low solvent power (solvency). This comes at the expense of ability to solubilise the polar additives present in the lubricating oil and the oxidation products (rubbers) formed during the exercise. The wide range of temperatures where PAO can work, together with the excellent chemical and physical characteristics, allows their use in various application areas.

Alkylated aromatics

The alkylbenzenes have lower characteristics if compared to PAOs but are used in refrigerant oils thanks to their excellent solubility and low pour point.

Polyglycols

Generally, they have high viscosity index which make them particularly suitable to obtain lubricating oils for the transmissions but they have a low oxidation resistance.

Polybutenes

Polybutenes are cut-resistant polymers and are used as Viscosity Index Improver (VII). They have higher volatility but lower resistance to oxidation and lower viscosity compared to PAOs and esters. In synthetic lubricants, polybutenes are usually combined with esters and PAOs and may affect the control of the lubricant viscosity, arising low deposit’s formation and thickening.

Synthetic esters

The most immediate effect of the ester group on lubricant properties is a lower volatility and an increased flash point. The esters influence other properties such as thermal stability, the solvent power, the lubricity, the biodegradability.

Poly internal olefins (PIO)

PIOs are characterized by high viscosity index, excellent rheological behaviour at low and high temperature, low volatility and good thermal-oxidative behaviour. They are employed as lubricants for internal combustion engines or industrial machineries.


4. Non conventional base oils

Non conventional base oils (NCBO) are produced from vacuum cuts treated through  hydrogen-processes. The two main processes are hydrocracking and waxes hydro-isomerization. NCBOs offer two important advantages: hydrogen-processes can replace solvent extraction, reducing the dependence on crude origin and they ensure high quality base oils (better than conventional ones) due to a lower volatility, higher viscosity index, better temperature stability and lower sulphur content.


5. Re-refined base oils

The re-refined bases are produced by re-processing exhausted oils which cannot be lost in the environment but must by low collected into authorized centres from where they can be sent to controlled combustion plants or  re-refined.

The re-refining processes, which consist on a treatment for removing volatile and insoluble components and additives, are able to produce lubricant bases with the same characteristics of mineral bases.

Re-refining yields allow to obtain for every 100 kg of exhausted oil about 60 kg of re-refined oil.

The treatment ends with a hydrogen treatment which eliminates or reduces the content of polynuclear aromatics (PNA), carcinogenic agents.


6. Base oil categories

Lubricating base oils are classified according to the physical characteristics and / or production process. The API (American Petroleum Institute) classifies base oils into five groups [3].

Group I – These oils are usually processed with solvents and they have a good degree of solvency, but they are most vulnerable to oxidation and thermal degradation compared to oils processed in different manner. The oils of Group I are used in almost all applications in the automotive and industrial field and are important for the  formulation of lubricating greases.

Group II – Oils subjected to mild hydrocracking and catalytic de-waxing. They have high saturation levels, and good performance in terms of thermal and oxidation stability. These oils are used in a large range of automotive and industrial applications.

Group III – Typically subjected to severe hydrocracking, advanced catalytic de-waxing, and / or hydro-isomerization, they have high viscosity indexes and very good thermal and oxidation stability. They are used primarily in the automotive sector.

Group IV – Oils produced synthetically. The main characteristics relate to low pour points, high viscosity indexes, excellent thermal stability and excellent oxidation stability. These oils are used primarily in the automotive industry, such as high-quality motor oils and transmission oils.

Group V – This group includes base oils which are not present in other groups such as naphthenic, esters and polyglycols.


Table

Table 1 – API Classification of base oils and related production method [4]


7. Lubricants from renewable sources

The development of lubricants is traditionally based on mineral oils due to good technical properties and reasonable price of mineral oil. A disadvantage of mineral oil is its poor biodegradability which may cause environmental pollution.

Consequently, the research has evolved in the field of synthetic esters used as lubricants, exploiting renewable resources for the production of fatty acids.

In this way, the lubricants are sustainable and biodegradable. The physic-chemical properties of esters are able to cover the entire range of technical requirements for the industrial lubricant development, ensuring high performances.

Experimental studies performed on synthetic esters have been done on different types of formulations, meanly in lubricants based on saturated and unsaturated esters [5].

The oxidation stability of saturated ester bases is higher than the one of unsaturated esters. Particularly for rapeseed oil the oxidation stability of saturated esters can be compared to the one of mineral oil bases. Esters exhibit less friction than mineral oil.


8. New trends in lubricant technology

In many industrial applications the technological advancement is strongly linked to innovation in the field of lubricants. For this reason, important efforts are made in order to improve their quality. The objective is twofold: on one hand the duration increasing and the friction reduction; on the other, the reduction of environmental impact due to the use of fossil lubricants.

To meet these challenges researches in the use of ionic liquids as new generation of lubricants are ongoing.

These new systems show a significant improvement in wear and friction. Ionic liquids consist of large molecules, asymmetric organic cations and an inorganic anions. The large size induce widespread charges and reduced electrostatic forces among anion so much to rarely form a regular crystal structure and they may be liquid at room temperature. Ionic liquids have different properties that make them suitable as potential lubricants. Their low volatility, low flammability and thermal stability allows to safely absorb the increase in temperatures and pressures that occur when there is high friction [6].

Another significant advantage is the variety of usable anions and cations, they estimate at least one million of possible combinations, each one with its specific properties [7]. This means that ionic liquids can be made specifically for particular applications with high flexibility. For example the specific tasks may concern the absorption on a surface, a particular reaction, miscibility in a base oil etc.

For well-known lubrication systems, such as steel to steel, as well as for difficult lubricating systems such as steel to aluminium, ionic liquids have been shown to have better performance than available commercial lubricants. However ionic liquids are currently more expensive than conventional lubricants, so they may be limited to niche applications. For these reasons, actually ionic liquids are promising as lubricant additives, where it is possible a  more widespread use.

Numerous nanoparticles used as additives were explored in recent years. The results are very encouraging and show an overall improvement in performance in terms of friction and wear even with concentrations less than 2% (weight). In particular, some particles as CuO, ZnO and ZrO2 showed better performance when compared to the normal additives [8].


[1] This brief review is inspired from “Encyclopaedia of Hydrocarbons” by ENI, Treccani 2005, Vol 2.
[2] The figure is taken from “Encyclopaedia of Hydrocarbons” by ENI, Treccani 2005, Vol 2.
[3] http://www.wolfoil.com/it_com/technico-commercial/pst/Module_1.aspx
[4] The table is taken from “Encyclopaedia of Hydrocarbons” by ENI, Treccani 2005, Vol 2.
[5] B. Krzan, J. Vizintin 2004 “Ester Based Lubricants Deriwed From Renewable Resources”, Tribology in industry, Volume 26, No. 1&2.
[6] Minami, I.; Kamimuram, H.; Mori, S. 2007 “Thermo-Oxidative stability of ionic liquids as lubricating fluids”. J. Synth. Lubr., 24, 135–147.
[7] Canter, N. 2005 “Evaluating ionic liquids as potential lubricants” Tribol. Lubr. Technol., 61, 15–17.
[8] A. Hern, Battez, 2008, “CuO, ZrO2 and ZnO nanoparticles as anti-wear additive in oil lubricants”, Elsevier.


Advanced & Alternative Low-Emission Fuels

Author: Mauro Capocelli,  Researcher, University  UCBM – Rome (Italy)


1. Theme description

Global energy demand has dramatically increased in last years and most of the energy needs of the world today (>80%) is still covered by conventional fossil fuels such as coal, petroleum and natural gas (Table 1). The issues of energy efficiency in the fuel production/combustion and storage depletion as well as the increasing concerns about climate changes and environmental pollution related to conventional fuels, are driving the industrial R&D towards the development of alternative solutions. On this basis, this brief review focuses on the most recent strategies in the field of alternative fuel solutions with a specific insight into the low emission strategies of the automotive industry.


Immagine1

Table 1 – World primary energy consumption and percentage of share [1]


The emissions of the conventional fuel combustion are characterized mainly by the presence of carbon monoxide (CO), nitrogen oxides (NOx), Sulfur oxide (SOx), hydrocarbons and Particulate matter (PM). NOx are harmful to human health and act as precursor of tropospheric ozone. Acute CO poisoning can lead to high toxicity of the central nervous system and heart while a chronic exposure causes depression, confusion and memory loss. Carbon monoxide poisoning mainly causes hypoxia by combining with hemoglobin to form carboxyhemoglobin in the blood reducing the oxygen-carrying capacity of the blood. An exposition to more than 20 ppm SO2 can cause death; moreover SOx pollution strongly affects the life of entire ecosystems for the climate influence. Any recent medical research suggests that PM is among the most dangerous pollutants; the effects of its inhalation (both acute and chronic) is nowadays associated with the majority of respiratory diseases, from asthma to lung cancer and also to cardiopulmonary mortality, premature delivery, birth defects, and premature death.[2] Besides these strong environmental impacts, any conventional fuel contributes to generate greenhouse gas emissions causing the well-known climate changes. Wondering what happens when oils will runs out,  Prof. Chris Rhodes asserts that, although the world supply crude oil isn’t going to run out any time soon, it is impossible to follow the current production rate: “ from 1965 to 2005, we see that by the end of it, humanity was using two and a half times as much oil, twice as much coal and three times as much natural gas, as at the start, and overall, around three times as much energy: this for a population that had “only” doubled. Hence our individual average carbon footprint had increased substantially – not, of course, that this increase in the use of energy, and all else, was by any means equally distributed across the globe”[3]. Following the Kyoto Protocol and the subsequent national directives, the industrialized countries are setting stringer regulation policies of emission control for stationary and mobile sources. The main strategies for the development of low-emission vehicles (LEV) are the realization of alternative low-emission fuels for the conventional internal combustion engine vehicle (ICEV) and the development of new high-tech renewable LEV as hybrid and fuel cell vehicles (Fig. 1)[4]. Although these latter are making promising step-forward towards the commercialization[5], they have not still led to a considerable market because of economic, politic and technological barriers. This results in the persistence of ICEV as dominant design. Therefore, this design is the focus of recent R&D effort in order to decrease polluting emissions and to increase energy efficiency of engines (by developing injection, combustion chambers and ignition controlling technologies) as well as by ideating alternative (and more environmental friendly) fuels.

Immagine2

Figure 1 – Flame and flameless firing of heavy fuel oil
(left: flame mode – right: flameless) after Oltra and Saint Jean, 20093


2. Emulsions

The main pollutants in diesel emission, NOx and PM, have peculiar mechanisms of formation hindering the simultaneous reduction of both and making necessary a trade-off between the two possible pollutant emissions. Lowering the combustion flame temperature in order to reduce NOx generally causes disequilibrium in the balance of soot formation and burnout resulting in an increase in PM emissions. On the other hand, particulate emissions can be reduced by increasing the combustion temperature, an operation that results in increased NOx emissions.


Immagine3

Figure 2 – Regimes of soot and NOx formation expressed in terms of flame equivalence ratio (fuel:air ratio) and flame temperature.


One way to overcome this issue is to replace the fuel with emulsions of diesel oil and water (without retrofitting the engine system). Lif and Holmberg gave an extended review of the water in diesel related system[6]. Water emulsions in oil (W/O) are prepared by using surfactants through mechanical (and ultrasonic[7]), chemical[8], or electric homogenizing machine (i.g. water stirring into microdroplets in oil layers). Surfactants, thanks to the presence of both lipophilic and hydrophilic groups, can reduce the oil and water surface tension creating oil-in-water or water-in-oil two phase emulsions (layer of ionic surfactants can also prevent droplet merging). When the emulsion is heated, water droplets vaporizes breaking out the oil layer (microexplosion). The secondary atomization increases the superficial area of the fuels and air and mixing extent. Secondly, the presence of water dilutes the nuclei of soot growth limiting the soot growth rates. Moreover, the presence of water could enhance soot burnout by increasing the presence of oxidizing species. All these cited aspects can contribute to lower the PM emission inhibiting both soot and ash formation. On the other hand, the high latent heat of vaporization of water will act to lower the temperature causing the NOx emission reduction[9]. Nadeem et al. compared the engine and emission performances of emulsified fuels (5–15% of water) using conventional (CS) and gemini surfactants (GS). Their experimental results highlights the potentiality of W/O to significantly reduce the formation of thermal NOx (from more than 700 to 500 ppm), CO, SOx, soot, hydrocarbons and PM (more than 70% of reduction) in the Diesel engines[10].


3. Fuel desulphurization

Conventional techniques for desulfurization of transportation fuels are based on hydro–desulfurization (HDS), in which the sulfur in the fuel is removed as H2S. This technique has the drawbacks of limited efficiency for the low reactivity of benzothiophene and dibenzothiophene and high costs for the operating conditions and the hydrogen implementation. On the other hand, the oxidative desulfurization is based on the conversion of non-polar aromatic hydrocarbons containing sulfur to corresponding sulfones, easily extractable with methanol. This liquid–liquid heterogeneous system, which depends on the mass transfer between the interface, can be enhanced through cavitation, both Ultrasonic and Hydrodynamic. Cavitation is the nucleation, growth, and transient collapse of micrometric gas-vapor bubbles driven by a pressure variation. It induces physical and chemical effects[11] in the reaction system that enhance the kinetics and yield of the process (both mechanical and chemical). The chemical effects are in terms of the generation of radicals through the dissociation of gas and vapor molecules during the transient collapse of the cavitation bubbles. The physical effects in terms of turbulence generation and therefore viscous dissipative eddies, shock waves and microjets can be exploited to create emulsion by reducing the mass transfer limitations[12]. A brief description of ultrasonic desulfurization is given by the Sulphco, Inc., a Nevada corporation; it reported great results in the enhancement of fuel desulfurization showing an impressive translation to sulfone concentration through an innovative treatment with ultrasonic horns[13]. Several innovative application of cavitation desulfurization, from patents to applied research and technology development, appeared in the literature[14]. While in the acoustic cavitation, the pressure variation is given by ultrasonic waves, in the hydrodynamic one, it is realized through properly designed flow restriction operating at different pressures and flow rates. An example of the bubble dimensions and shear stresses at the collapse stage is shown in Figure 3.

Immagine4
Figure 3 – Simulation of bubble radius and bubble wall velocity for different configuration of hydrodynamic cavitation operating parameters[15].


4. Alternative fuels

The generally shared belief that the upcoming shortage of oil will accelerate the switch to alternative fuels, all the major oil and automotive companies have alternative fuels research programs[16]. Moreover, the R&D in alternative fuels is often related to environmental friendly strategies. The term alternative fuels comprises hydrogen, compressed natural gas (CNG) and liquefied petroleum gas (LPG), biogas, dimethylether (DME), alcohols such as methanol and ethanol, liquefied petroleum gas (LPG), vegetable oils and fatty acid methyl esters, and blends of these with gasoline or diesel. Therefore, there are different opinions and an ultimate decision about which type of products will dominate the market for vehicle fuels in the future is uncertain and depends on political as well as economic considerations. As visible from the Figure 4, indeed the cost of alternative fuels (ethanol produced from corn in the U.S.) often follows the cost of the equivalent conventional one which is gasoline, the principal market competitor (and rarely is strictly connected to the prices of raw matherials). Generally, the fuels generation can follow the pathway of Natural gas, Biomasses or Electricity. Natural gas is a versatile fuel, employable in modified spark-ignition engines or in dedicated engines[17]. It can be used directly in compressed or liquefied form and converted to methanol, dimethyl ether (DME), gas-to-liquid (GTL) fuel or Fischer–Tropsch diesel. Both PM and NOx emissions from natural gas-derived fuels are very low while sulphur emissions is usually negligible. Liquefied petroleum gas (LPG) is mainly composed by propane and butane (and homologues liquefying at ~800 kPa) and released during the extraction of crude oil and gases of oil refining processes. LPG fuels are based on light low-carbon, clean-burning hydrocarbons and their implementation can bring to substantial reductions of CO, NOx, hydrocarbons and emissions of greenhouse gases. DME (born as an ignition improver of methanol) can be produced from different feedstock such as natural gas, coal, oil residues and biomasses. It has good ignition properties (high cetane number and low auto-ignition temperature); moreover its simple chemical structure and high oxygen content result in soot-free combustion in engines[18].

Immagine5
Figure 4 – Biodiesel Production (millions of gallons/year) in the top world countries (2013) extracted from the 2013 Renewable Energy Data Book[19]


Arcoumanis et al. gave a review of the potential benefits of using DME as alternative fuel in standard compression-ignition engines with slight modification of the conventional system (paying attention to the corrosion and low lubricity related issues)[20]. Hydrogen can be used as a fuel in internal combustion engines and in fuel cells with zero pollutant emission. It can be produced from natural gas as well as water electrolysis. From the economic point of view, its utilization is controlled by the cost and the source of electrical energy. Toyota Mirai, the first commercialized fuel cell car, is recently finding a great success highlighting that the spreading of such kind of technologies is limited only by infrastructural issues: distribution chain, storage and handling (both in vehicles and at gas stations). Although these issues are not yet overcome, hydrogen represents a concrete frontier for the automotive industry. The biomass for fuel production can have various origins, such as black liqueur, forestry residues, or municipal or industrial waste products. The resulting fuels are. Among all the different biomass based fuels, the most accessible ones today are diesel and ethanol. Other resulting fuels are methanol, DME and Fischer-Tropsch diesels while the gasification processes of biomass results in biogas-to-liquid fuels. Biodiesel is conventionally made by transesterification of a triglyceride with methanol (fatty acid methyl ester). It can be used either pure or as blends with regular diesel with the benefit of reduced CO, CO2 hydrocarbon and PM emissions. Biodiesel combustion produces higher NOx emission (to be treated with improved catalytic filters) while reduces the SOx emission to almost zero. Rape seed and sunflower are among the main source of biodiesel edible raw material.  To minimize the reliance on edible vegetable oil and to exploit the naturally available oil plants, Ashraful et al. studied the fuel properties, engine performance, and emission characteristics of biodiesel from various non-edible vegetable oils (karanja, mohua, rubber seed, and tobacco biodiesel) providing a detailed extensive review in this field[21]. Based on their findings (reduce CO, HC and smoke emission) they asserts that non-edible oils have the potential to replace edible oil-based biodiesels in the near future (some controversy arise from the NOx point of view). In 2013 the total biodiesel production was 6,948 millions of gallons with an increase of the 17% from 2012 to 2013. In 2013 the United States led the world in biodiesel production, followed by Germany, Brazil, Argentina, and France and Indonesia (U.S. cost of 3.92 $/gall in 2013)[22]. Because of the reduction of PM emission in oxygenated fuels, the alcohols are particularly attractive as alternative to the conventional ones. Gravalos et al. described the Performance and Emission Characteristics of Spark Ignition Engine Fuelled with Ethanol and Methanol Gasoline Blended Fuels highlighting the mixture properties (reported in Table 2)[23]. Moreover, they can be produced as biofuels (also not linked to the food production). In 2013, the Indian River BioEnergy Center began producing cellulosic ethanol at commercial volumes for the first time and now is among the major technology center in the field of bioenergy. Its goal is to << take wastes and sustainably turn them into advanced biofuel and renewable power>>[24]. Methanol can be produced from coal, biomass or even natural gas while ethanol mainly from sugar cane, starch wheat or wine. All car manufactures have approved the use of E10, a blend of 10% ethanol and 90% gasoline and E5, blend of 5% ethanol and 95% gasoline in the ordinary gasoline cars and these blends are commonly available in the US and in Europe. In Brazil the majority of the cars utilizes neat ethanol or lower level blends produced from sugar cane while in the U.S. the ethanol production (13,300 million gallons in 2013,) is mainly based on corn. In 2013 the U.S. led the world market (57% of the overall production) followed by Brazil at 27% and E.U. at 6% (see Figure 3). To understand the order of magnitude of the number reported above, Figure 5 shows the data (taken from the U.S. Department of Energy report[25]) related to the consumption of renewable and alternative fuel (top) with a comparison to the consumption of traditional fuel (bottom) in the United States (for the year 2013).

Immagine6

Table 2 – Properties of different ethanol and methanol gasoline blended fuels (extracted from ref. 20)


Immagine7

Figure 5 – Consumption of renewable and alternative fuel (top) and of traditional fuel (bottom) in the United States (for the year 2013).

________

[1] A.M. Ashraful et al. / Energy Conversion and Management 80 (2014) 202–228
[2] http://www.epa.gov/airquality/urbanair/
[3] http://oilprice.com/Energy/Crude-Oil/What-Happens-When-the-Oil-Runs-Out.html
[4] V. Oltra, M. Saint Jean / Journal of Cleaner Production 17 (2009) 201–213
[5] http://www.toyota-global.com/innovation/environmental_technology/fuelcell_vehicle/
[6] A. Lif, K. Holmberg / Advances in Colloid and Interface Science 123– 126 (2006) 231–239
[7] C.-Y. Lin, L.-W. Chen / Fuel 85 (2006) 593–600
[8] C.-Y. Lin, H.-A. Lin / Fuel Processing Technology 88 (2007) 35–41
[9] J. Ghojel et al. / Applied Thermal Engineering 26 (2006) 2132–2141
[10] M. Nadeem et al. / Fuel 85 (2006) 2111–2119
[11] M. Capocelli et al. / Chemical Engineering Journal 210 (2012) 9–17
[12] Bhasarkar et al., Ind. Eng. Chem. Res. 2013, 52, 9038−9047.
[13] http://www.usaee.org/chapters/documents/Houston_090611.pdf
[14] Desulfurization process and systems utilizing hydrodynamic cavitation. US 8002971 B2. Production of Biofuels and Chemicals with Ultrasound. Springer Dordrecht Heidelberg New York London 2015. http://sonomechanics.com/applications/fuel_upgrading/crude_oil_desulfurization/
[15] Capocelli M., et al., 2014. Chemical Engineering Transactions, 38, 13-18
[16] http://www.eni.com/en_IT/innovation-technology/technological-answers/clean-mobility/clean-mobility.shtml. http://www.shell.com/global/environment-society/environment/climate-change/biofuels-alternative-energies-transport.html. http://www.bp.com/en/global/corporate/about-bp/what-we-do/generating-low-carbon-energy.html.
[17] http://www.nrel.gov/transportation/news/2013/10343.html
[18] A. Lif, K. Holmberg / Advances in Colloid and Interface Science 123– 126 (2006) 231–239
[19] U.S. Department of Energy, Energy Efficiency &Renewable Energy. 2013 Renewable Energy Data Book
[20] Arcoumanis et al., 2008. The potential of di-methyl ether (DME) as an alternative fuel for compression-ignition engines: A review. Fuel 87 (2008) 1014–1030
[21] A.M. Ashraful et al. / Energy Conversion and Management 80 (2014) 202–228
[22] U.S. Department of Energy, Energy Efficiency &Renewable Energy. 2013 Renewable Energy Data Book
[23] Gravalos et al., 2011. Alternative Fuel, Dr. Maximino Manzanera (Ed.), ISBN: 978-953-307-372-9, InTech.
[24]  http://www.ineos.com/global/bio/company/ineos%20us%20bio%20brochure_april%202012.pdf
[25] U.S. Department of Energy, Energy Efficiency &Renewable Energy. 2013 Renewable Energy Data Book


Biorefinery

Author: Vincenzo Piemonte, Associate Professor, University UCBM – Rome (Italy)


1. Theme description 

Many efforts have been made to move from today’s fossil based economy to a more sustainable economy based on biomass. The reasons can be summarized as follow:

  • the need to develop an environmentally, economically and socially sustainable global economy,
  • the anticipation that oil, gas, coal and phosphorus will reach peak production in the not too distant future and that prices will climb,
  • the desire of many countries to reduce an over dependency on fossil fuel imports, so the need for countries to diversify their energy sources,
  • the global issue of climate change and the need to reduce atmospheric greenhouse gases (GHG) emissions.

Current global bio-based chemical and polymer production (excluding biofuels) is estimated to be around 50 million tonnes [1]. Examples of bio-based chemicals include non-food starch, cellulose fibres and cellulose derivatives, tall oils, fatty acids and fermentation products such as ethanol and citric acid. However, the majority of organic chemicals and polymers are still derived from fossil based feedstocks, predominantly oil and gas.

Recently, the consumer demand for environmentally friendly products, the population growth and limited supplies of non-renewable resources have opened new opportunities for bio-based chemicals and polymers.

Bio-based goods can be produced in single product processes or in an integrated biorefinery processes producing both bio-based products and secondary energy carriers (fuels, power, heat), in analogy with oil refineries [2][3].

Actually, the main driver for the development and implementation of biorefinery processes is the transportation sector. Significant amounts of renewable fuels are necessary in the short and midterm to meet policy regulations both in- and outside Europe.

A very promising approach to reduce biofuel production costs is to use so called biofuel-driven biorefineries for the co-production of both value-added products (chemicals, materials, food, feed) and biofuels from biomass resources in a very efficient integrated approach.

From an overall point of view, a key factor in the realisation of a successful bio-based economy will be the development of biorefinery systems that are well integrated into the existing infrastructure.

At the global scale, the production of bio-based chemicals could generate US$ 10-15 billion of revenue for the global chemical industry [3].


Immagine1

Figure 1 – Biorefinery system scheme [2]


Biorefineries can be classified mainly on the feedstocks used to produce bio-based goods (see figure 1). Major feedstocks are perennial grasses, starch crops (e.g. wheat and maize), sugar crops (e.g. beet and cane), lignocellulosic crops (e.g. managed forest, short rotation coppice, switchgrass), lignocellulosic residues (e.g. stover and straw), oil crops (e.g. palm and oilseed rape), aquatic biomass (e.g. algae and seaweeds), and organic residues (e.g. industrial, commercial and post consumer waste). These feedstocks can be processed in different unit of a  biorefinery, called platforms. The platforms include single carbon molecules such as biogas and syngas, 5 and 6 carbon carbohydrates from starch, sucrose or cellulose; a mixed 5 and 6 carbon carbohydrates stream derived from hemicelluloses, lignin, oils (plant-based or algal), organic solutions from grasses, pyrolytic liquids. These primary platforms can be converted to wide range of marketable products using combinations of thermal, biological and chemical processes.


2. Biobased Platforms

2.1 Biogas Platform

Actually, biogas production is mainly based on the anaerobic digestion (see figure 2) of “high moisture content biomass” such as manure, waste streams from food processing plants or waste from municipal effluent treatment systems. Biogas production from energy crops will also increase and will have to be based on a wide range of crops that are grown in versatile, sustainable crop rotations. Biogas production can be part of sustainable biofuels-based biorefineries as it can derive value from wet streams. This value can be increased by optimizing methane yield and economic efficiency of biogas production [4] and deriving nutrient value from the digestate streams [5].


Immagine2

Figure 2 – Biogas production system scheme


2.2 Sugar Platform

Sugar platforms can implements processes to degrade sucrose in glucose or to hydrolyse starch or cellulose in glucose. Glucose serves as feedstock for fermentation processes to give a variety of important chemical building blocks.

The hydrolysis of hemicelluloses and then the fermentation of these resulted carbohydrate streams can in theory produce the same products as six carbon sugar streams; however, technical, biological and economic barriers need to be overcome before these opportunities can be exploited. Chemical manipulation of these streams can provide a range of useful molecules (see figure 3).

Indeed, by selective dehydration, hydrogenation and oxidation reactions it is possible to obtain useful products, such as: sorbitol, furfural, glucaric acid, hydroxymethylfurfural (HMF), and levulinic acid. Over 1 million tonnes of sorbitol is produced per year as a food ingredient, personal care ingredient (e.g. toothpaste), and for industrial use [6], [7].


Immagine3

Figure 3 – Sugar platform scheme [2]


2.3 Vegetable Oil Platform

Global oil production in 2009 amounted to 7.7 million tones of fatty acids and 2.0 million tonnes of fatty alcohols [8]. The majority of fatty acid derivatives are used as surface active agents in soaps, detergents and personal care products [9].

Major sources for these oils are coconut, palm and palm kernel oil, which are rich in C12–C18 saturated and monounsaturated fatty acids. Rapeseed oil, high in oleic acid, is a favoured source for biolubricants. Commercialized bifunctional building blocks for bio-based plastics include sebacic acid and 11-aminoundecanoic acid, both from castor oil, and azelaic acid derived from oleic acid. Dimerized fatty acids are primarily used for polyamide resins and polyamide hot melt adhesives.

Biodiesel production has increased significantly in recent years with a large percentage being derived from palm, rapeseed and soy oils. In 2009 biodiesel production was around 14 million tonnes; this quantity of biodiesel co-produces around 1.4 million tonnes of glycerol.

Glycerol is an important co-product of fatty acid/alcohol production. The glycerol market demand in 2009 was 1.8 million tonnes [8]. Glycerol is also an important co-product of fatty acid methyl ester (FAME) biodiesel production. It can be purified and sold for a variety of uses [5].

2.4 Algae Oil Platform

Algae biomass can be a sustainable renewable resource for chemicals and energy. The major advantages of using microalgae as renewable resource are:

  • Compared to plants algae have a higher productivity. This is mostly due to the fact that the entire biomass can be used in contrast to plants which have roots, stems and leafs. For example, the oil productivity per land surface can be up to 10 times higher than palm oil.
  • Microalgae can be cultivated in seawater or brackish water on non-arable land, and do not compete for resources with conventional agriculture.
  • The essential elements for growth are sunlight, water, CO2 (a greenhouse gas), and inorganic nutrients such as nitrogen and phosphorous which can be found in residual streams.
  • The biomass can be harvested during all seasons and is homogenous and free of lignocellulose.

Microalgae can contain a high protein content, with all 20 amino acids present. Carbohydrates are also present and some species are rich in storage and functional lipids. Other valuable compounds include: pigments, antioxidants, fatty acids, vitamins, anti-fungal, -microbial, -viral toxins, and sterols.

2.5 Lignin Platform

Until now, the lignin platforms are mainly based on lignosulfonates (see figure 4). These sulfonates are separated from acid sulfite pulping and are used in a wide range of lower value applications. Major end-use markets include construction, mining, animal feeds and agriculture uses.

Immagine4

Figure 4 – Lignin platform scheme [2]


Besides lignosulfonates, Kraft lignin is produced as commercial product at about 60kton/y. New extraction technologies, will lead to an increase in Kraft lignin production at the mill side for use as external energy source and for the production of value added applications [10].

The production of bioethanol from lignocellulosic feedstocks could result in new forms of higher quality lignin becoming available for chemical applications. The production of more value added chemicals from lignin (e.g. resins, composites and polymers, aromatic compounds, carbon fibres) is viewed as a medium to long term opportunity which depends on the quality and functionality of the lignin that can be obtained [11].


3. Opportunities

The opportunities for chemical and polymer production from biomass has been comprehensively assessed in several reports and papers [12], [13], [14], [15], [16], [17].

Immagine5

Figure 5 – Plastics Europe anticipated biopolymer production capacity (in tonnes/year) by 2015


Bio-PE:Biorenewable Polyethylene; Bio-PET: Biorenewable Polyethylene Thereftalate; PLA: Polylactic Acid; PHA: Polyhydroxy Alchanoates; BP: Biodegradable Polyesters; BSB: Biodegradable Starch Blends; Bio-PVC: Biorenewable Polyvinyl chloride ; RC: Regenerated Cellulose; PLA-B:  Polylactic Acid Blends; Bio-PP: Biorenewable Polypropylene; Bio-PC: Biorenewable Polycarbonate.

An international study14 found that with favourable market conditions the production of bulk chemicals from renewable resources could reach 113 million tonnes by 2050, representing 38% of all organic chemical production. Under more conservative market conditions the market could still be a significant 26 million tonnes representing 17.5% of organic chemical production (see figure 5).

Currently, commercialised bio-polymers (i.e. PLA, PHA, thermoplastic starch) are demonstrating strong market growth. Market analysis shows growth per annum to be in the 10-30%  range [18], [19], [20].

Bio-based polymer markets are dominated by biodegradable food packaging and food service applications.  It can be rationalised that the production of more stable, stronger and longer lasting biopolymers will lead to CO2 being sequestered for longer periods and leads to recycling rather than composting where the carbon is released very quickly without any energy benefits5.

Between the most important players in biorefining, there are Novamont (Italy) leader on biodegradable bags based on Mater-Bi (bioplastic derived from thermoplastic starch); NatureWorks (U.S.A)  leader in the PolyLacticAcid production (a biobased plastic used also for the production of biodegradable bottles) and Biochemtex belongs to M&G Chemicals Group (Italy) specialized in the production of bioethanol of second generation.


 ____________

[1] Higson, A 2011. NNFCC. Estimate of chemicals and polymers from renewable resources. 2010. NNFCC. Estimate of fermentation products. 2010. Personal communication
[2] Kamm, B., P. Gruber, M. Kamm [ed.]. Biorefineries – Industrial Processes and Products. Weinheim : Wiley-VCH, 2006. ISBN-13 978-3-527-31027-2.
[3] World Economic Forum. The Future of Industrial Biorefineries. s.l. : World Economic Forum, 2010.
[4] Bauer A., Hrbek a, B. Amon, V. Kryvoruchko, V. Bodiroza, H.Wagentristl, W. Zollitsch, B. Liebmanne, M. Pfeffere, A. Friedle, T. Amon. 2007. Potential of biogas production in sustainable biorefinery concepts.  (http://www.nas.boku.ac.at/uploads/media/OD7.1_Berlin.pdf).
[5] De Jong E., Higson A., Walsh P., Wellisch M., 2011, Bio-based Chemicals Value Added Products from Biorefineries, IEA Bioenergy, Task 42 Biorefinery.
[6] Vlachos, D.G. J. G. Chen,R. J. Gorte, G.W. Huber, M. Tsapatsis. Catalysis Center for Energy Innovation for Biomass Processing: Research Strategies and Goals. Catal Lett (2010) 140:77–84
[7] ERRMA. EU-Public/PrivateInnovation Partnership “Building the Bio-economy by 2020”. 2011.
[8] ICIS Chemical Business. Soaps & Detergents Oleochemicals. ICIS Chemical Business. 2010, January 25-February 7.
[9] Taylor D.C., Smith M.A., Fobert P, Mietkiewska E, Weselake R.J. 2011 Plant systems – Metabolic engineering of higher plants to produce bio-industrial oils. In: Murray Moo-Young (ed.), Comprehensive Biotechnology, Second Edition, volume 4, pp. 67–85. Elsevier.
[10] Öhman, F., Theliander, H., Tomani, P., Axegard, P. 2009. A method for separating lignin from black liquor, a lignin product, and use of a lignin product for the production of fuels or materials. WO104995
[11] Zakzeski, J., P.C.A. Bruijnincx, A.L. Jongerius, and B.M. Weckhuysen. The catalytic valorization of lignin for the production of renewable chemicals. Chemical Reviews 110 (6), 3552-3599.
[12] Shen, L., Haufe, J., Patel, M.K. Product overview and market projection of emerging bio-based plastics. s.l. : Utrecht Univeristy, 2009.
[13] U.S. Department of Agriculture. U.S. Biobased Products, Market Potential and Projections Through 2025. s.l. : U.S. Department of Agriculture, 2008.
[14] Patel, M., Crank, M., Dornburg, V., Hermann, B., Roes, L., Hüsing, B., van Overbeek, L., Terragni, F., Recchia, E. 2006. Medium and long-term opportunities and risks of the biotechnological production of bulk chemicals from renewable resources – The BREW Project. (http://www.projects.science.uu.nl/brew/programme.html)
[15] Bozell, J.J., G.R. Petersen. 2010.Technology development for the production of biobased products from biorefinery carbohydrates – the US Department of Energy’s “Top 10” revisited. Green Chemistry.12, 539-554.
[16] Werpy, T, G. Petersen. 2004. Top Value Added Chemicals from Biomass, Volume 1 Results of Screening for Potential Candidates from Sugars and Synthesis Gas. (http://www1.eere.energy.gov/biomass/pdfs/35523.pdf)
[17] Nexant ChemSystems. Biochemical Opportunities in the Uniten Kingdom. York : NNFCC, 2008.
[18] Pira. The Future of Bioplastics for Packaging to 2020. s.l. : Pira, 2010.
[19] SRI Consulting. Biodegradable Polymers. [Online] [Cited:17 January 2011.] http://www.sriconsulting.com/CEH/Public/Reports/580.0280.
[20] Helmut Kaiser Consultancy. Bioplastics Market Worldwide 2007-2025. [Online] 2009. [Cited: 17 January 2011.] http://www.hkc22.com/bioplastics.html.


New Catalytic Process for Production of Olefins

Author: Marcello De Falco, Associate Professor, University UCBM – Rome (Italy)


1. Theme description

Olefins, mainly ethylene (C2H4) and propylene (C3H6), are key intermediate and feedstock for the production of a wide number of chemical products, as the polyolefins (polyethylene – PE, polypropylene – PP), Mono-ethylene glycol (MEG), Ethylene Oxide (EO) and derivatives, Propylene Oxide (PO) and derivatives, Polyvinyl chloride (PVC), ethylene dichloride (EDC), Styrene, Acrylonitrile, Cumene, Acetic Acid, etc.

At the present, the worldwide demand of ethylene/propylene is more than 200 million tons per year but the conventional processes suffer for a series of problems as the high cost and low conversion efficiency.

In the following, the traditional technologies, i.e. the Thermal Steam Cracking and the Fluid Catalytic Cracking, are firstly presented. Then the innovation in the olefins production are described and assessed.


2. Olefins production conventional processes

The most used olefins industrial production processes are:

  • Thermal Steam Cracking (TSC);
  • Fluid Catalytic Cracking (FCC).

TSC is a thermal process by which a feedstock, typically composed by naphtha, ethane or propane, is heated up in a furnace composed by both a convection and radiant section, and mixed with steam to reduce the coke formation. The steam addition depends on the TSC feedstock (from 0.2 kg steam to kg of hydrocarbon for ethane to 0.8 kg steam to kg of hydrocarbon for naphtha).

Then the products (ethylene, propylene, butadiene, hydrogen) are quickly cooled down to avoid subsequent reactions (quenching) and then are separated by means of a series of operations (refer to Figure 1).

The reactions structure involved in thermal cracking is complex and, generally, is based on a free radical mechanism. Basically, two types of reactions are supported in a thermal cracking process:

  • primary cracking, with the initial formation of paraffin and olefins;
  • secondary cracking, with the formation of light products rich in olefins are formed.

TSC is an energy intensive process: the specific energy consumption per kg of produced olefin is 3.050 kcal/kg.

FCC is a multi-component catalytic system, where the catalyst pellets are “fluidized” thanks to the inlet steam flow-rate and the cracking process is supported at lower temperature than TSC. A typical block diagram is shown in Figure 2, while a FCC reactor drawing is reported in Figure 3.

Olefins production traditional technologies suffer from inefficiency due to high temperature/high energy costs, complex and expensive separation units and significant CO2 emissions.

As a consequence, a strong interest towards the development of more flexible, more efficient with a lower environmental impact and less expensive catalytic olefin production technologies is growing.

In the following, some of the most interesting technologies developed during the last years are presented and described.

Immagine1

Fig. 1 – Thermal Steam Cracking plant layout [1] 


Immagine2

 Fig. 2 – Fluid Catalytic Cracking block diagram [2]


Immagine3

 Fig. 3 – FCC reactor drawing [2]


3. Innovative Technologies

Advanced Catalytic Olefins (ACO)

The Advanced Catalytic Olefins (ACOTM) technology has been developed by Kellogg Brown & Root LLC (KBR) and SK Innovation Global Technology. The process is an FCC-type with an improved catalyst able to convert the feedstock in larger quantities of ethylene and propylene, with a higher share of propylene than conventional processes (the ratio of produced propylene to produced ethylene is 1 versus 0.7 of the commercial processes). The ACO process produces 10-25% more olefins than the traditional FCC processes, with a reduction of consumed energy per unit of olefins by 7-10% [3].

The plant configuration is composed of 4 sections: riser/reactor, disengager, stripper and regenerator. Figure 4 shows a simplified process scheme, while Figure 5 illustrates a picture of the first ACO commercial demonstration unit, installed in South Korea and with a production capacity of 40 kta of olefins.

Immagine4

Fig. 4 – ACO plant process scheme [3]


Immagine5

Fig. 5 – ACO Commercial Demonstration unit installed in Ulsan (South Korea)


PCC Process

The Propylene Catalytic Cracking is a fluid solids naphtha cracking process patented by Exxon Mobil and based on an optimization of catalyst, reactor design and operating conditions set able to modulate the reactions selectivity, leading to crucial economic benefits in comparison with the conventional processes.

The PCC process is able to produce directly the propylene at the chemical grade concentrations, thus avoiding the expensive fractionation units. Moreover, the specific operating conditions allows the minimization of aromatics production [4].

Exxon is testing the innovative solutions on tailored pilot facilities.

Indmax FCC Process

The Indmax process, developed by the Indian Oil Corporation, is able to convert heavy feedstock to light olefins. It is a FCC-type process where the reactions are supported by a patented catalyst, able to reduce the contact time and thus leading to higher selectivity to light olefins (ethylene and propylene).

Another crucial characteristic of I-FCC process is the high production flexibility: the process can be easily adjusted to modulate the output, maximizing propylene, gasoline or producing combinations (propylene and ethylene or propylene and gasoline) [5].

Aither Chemicals’ catalytic process

Aither Chemicals, a company located in the U.S., developed an innovative catalytic cracking process for the production of ethylene, acetic acid, ethylene derivatives as ethylene oxide (EO) and ethylene glycol (EG), polyethylene (PE, LLDPE, HDPE), acetic acid derivatives as acetic anhydride, ethylene-acetic-acid derivatives such as vinyl acetate monomer (VAM), ethyl vinyl acetate (EVA) and other chemicals and plastics [6]. The process uses oxygen instead of water steam and, globally, needs much lower energy (-80%) and produces 90% less carbon dioxide, being more environmentally sustainable.

Moreover, the CO2 and CO streams are captured at the outlet of the catalytic process and utilized for producing chemicals and polymer, thus nullifying the GreenHouse Gases emissions.

The production volumes foreseen for the innovative process are 224 ktons of ethylene, 112 ktons of acetic acid, 30 ktons of CO2 and 15 ktons of CO.

Methane-to-olefins processes

Many research efforts are devoted to find new routes and process configurations to convert directly natural gas to olefins by low temperature reactors.

There are two possible methane-to-olefins (MTO) processes:

  • Indirect process, by which methane is converted into syngas, methanol or ethane and then olefins are produced;
  • Direct process, by which olefins are directly produced from the methane in a single conversion step composed by modified Fischer-Tropsch reaction.

Even if the direct route seems to be more interesting, at the present not a good light olefins selectivity has been obtained [7] and the MTO processes are more energy intensive than the conventional cracking technologies. The only pre-commercial scale application has been developed by UOP and Total Petrochemicals in Feluy (Belgium): the plan is an indirect process able to produce ethylene and propylene through methanol and syngas.

Immagine6

Fig. 6 – MTO plant in Feluy, Belgium [8]


Some interesting patents have been produced on the MTO topic [9], [10], [11], as well some accurate scientific publications on important international journals [12], [13], [14].

Propane Dehydrogenation

The company UOP developed an innovative Propane Dehydrogenation (PDH) process able to produce ethylene and propylene at lower cost thanks to a lower energy usage and a more stable platinum-based catalyst [15]. The process, called Oleflex, is divided in three sections: the reaction, consisting of four radial-flow reactors, the product purification and the catalyst regeneration. Fig. 7 shows a process layout. Currently, 6 Oleflex units are installed and produce more than 1.250.000 MTA of propylene worldwide.

Immagine7

Fig. 7 – UOP’s Oleflex process layout [8]


Shell Higher Olefins Process

The Shell Higher Olefins Process (SHOP) is an innovative olefins production technology, developed by Royal Dutch Shell, based on a homogeneous catalyst and used for production of linear α – olefins (from C4 to C40) and internal olefins from ethene.

The process architecture consists of three steps:

  • Oligomerization (conversion of a monomer or a mixture of monomers into an oligomer, temperature = 90–100°C, pressure = 100–110 bar, polar solvent);
  • Isomerization (molecules rearrangement reaction by a metal catalyst, 100–125° C and 10 bar);
  • Methathesis (alkenes are converted into new products by breaking – up and reformation of C-C double bonds by an alumina-based catalyst, 100–125° C and 10 bar) [17].

At the present, SHOP is widely applied and the worldwide production capacity is 1.190.000 t of linear alpha and internal olefins per year.

Catalytic Partial Oxidation of ethane

ENI and the Italian research centre CNR developed an ethylene production process through Short Contact Time – Catalytic Partial Oxidation (CPO) of ethane.

The process is supported by a patented monolithic catalyst able to improve the ethylene yield up to 55 wt.% [18].

At the present, the technology has been validated trough a bench-scale unit, by which the optimal operating conditions have been identified. However, the industrial scale application is not ready yet, since an optimization of the CPO reactor design and the improvement of the catalyst reliability are needed.


_______________

[1] http://nptel.ac.in/courses/103107082/module7/lecture2/lecture2.pdf
[2] http://nptel.ac.in/courses/103107082/module6/lecture5/lecture5.pdf
[3] http://www.kbr.com/Newsroom/Publications/Articles/Advanced-Catalytic-Olefins-ACO-First-Commercial-Demonstration-Unit-Begins-Operations.pdf
[4] M.W. Bedell, P.A. Ruziska, T.R. Steffens. On-Purpose Propylene from Olefinic Streams. Davison Catalagram, 94 (2004) – Special Edition: Propylene –
[5] http://www.cbi.com/images/uploads/tech_sheets/I-FCC-12.pdf
[6] http://www.aitherchemicals.com/2012/06/21/aither-announces-open-season/
[7] https://www.tut.fi/ms/muo/polyko/materiaalit/aa/apdf/polyko_technology_for_the_production_of_olefins.pdf
[8] http://plasticsengineeringblog.com/2013/02/20/how-shale-gas-is-changing-propylene/
[9] http://www.google.co.in/patents/US4450310
[10] http://www.google.com/patents/WO2014031524A1?cl=en
[11] http://www.freepatentsonline.com/7091391.html
[12] http://www.sciencedirect.com/science/article/pii/S0360544208000042
[13] http://www.hindawi.com/journals/jchem/2013/676901/
[14] http://www.netl.doe.gov/KMD/Cds/disk28/NG7-4.PDF
[15] http://www.uop.com/?document=uop-olefin-production-solutions-brochure&download=1
[16] epg.science.cmu.ac.th/…/article-download.php?id=
[17] http://www.kataliza.chemia.polsl.pl/makro-ic-wyk4a.pdf
[18] L. Basini, S. Cimino, A. Guarinoni “Short Contact Time Catalytic Partial Oxidation (SCT-CPO) for Synthesis Gas Processes and Olefins Production”. Ind. Eng. Chem. Res., 2013, 52 (48), 17023–17037.


Gasification Process

Author: Andrea Milioni – Chemical Engineer – On Contract Cooperator – University UCBM – Rome (Italy)


1. Theme description

The gasification process is the thermochemical conversion of a carbonaceous solid or liquid to a gas in presence of a gasifying agent: air, oxygen or steam. Compared to this definition, the combustion process could be associated as a gasification one, however, by definition, gasification requires that oxygen supply is lower than the amount required for complete combustion to carbon dioxide and water (the stoichiometric amount). In these conditions, the reaction products are not only carbon dioxide and water but consist of a combustible gas mixture with a given heating value which depends on three variables: feed elemental composition, inlet gas composition (air, oxygen or steam) and gasifier typology. Furthermore the process produces a solid carbonaceous phase (CHAR), condensable vapors (TAR) and ashes.

The gasification can be carried out directly by adding oxygen (or air) and by exploiting the exothermicity of the reactions to provide the energy necessary for the process or by pyrolysis, supplying heat from outside in the complete absence of oxygen. The gaseous products, essentially hydrogen, carbon monoxide, methane and carbon dioxide, may be used for several purposes such as heating, electricity generation and production of chemicals and fuels.

The gasification process, has been developed on an industrial scale during the 19th century to produce town gas for lighting and cooking. Later, the natural gas and electricity replaced it for these applications, and it was used only for the production of some synthetic chemicals. Since the ’70s, following the crisis of fossil fuels, the realization of dependence on foreign oil have led to the revaluation of the gasification process, in particular the biomass gasification, driven also by the interest in the reduction of greenhouse gas emissions and in the local availability of renewable energy sources.

2. Foundamentals

The gasification process can be divided into 4 basic steps (sketched in Figure 1) that occur within a suitable reactor: heating/drying, pyrolysis, gas-solids reactions and gas phase reactions [1]. When the reactor design ensures high-speed heat transfer and the feed is introduced as small particles, the whole process takes place in short time (about one second) [2].

Heating and drying: in this first step the temperature reaches about 300°C and the feed is completely dried. The greater the moisture amount, the higher the energy needed for drying, with a lower produced gases enthalpy. For this reason, a naturally dry (or previously dried) biomass is desirable. During the heating there is a typical heat transfer phenomenon, with a temperature profile decreasing towards the particle centre: the greater the radius, the longer the time required for the treatment.

Pyrolysis: in this second step, a rapid thermal anoxic degradation of the carbonaceous material takes place. The ideal temperature for this purpose is between 400 and 500°C.

Released products:

Gases: H2, CO, CH4, CO2 and some other light hydrocarbons.

Vapors: The exposition to high temperatures lead to a thermal cracking process generating light and condensable compounds (TAR, Topping Atmospheric Residue) consisting essentially in polyaromatic hydrocarbons.

Solids: residual porous called CHAR consisting in a carbon residue and inorganic compounds (ash).

Gas-Solid Reactions: reactions occurring between CHAR and the added gasifying agent (oxygen, steam, or both). Exothermic reactions, with negative , help to provide energy for the endothermic processes such as drying and pyrolysis.

Immagine 1

Gas-phase Reactions: there are two main gas-phase reactions, respectively, water gas shift and methanation, for the synthetic natural gas production.

Immagine2


Immagine3

Figure 1 – The Process of Thermal Gasification [3]


3. Gasifiers Typology

Depending on the modality of contact between the gasifying agent and the charge, four reactor types can be identified:

  • Fixed Bed;
  • Fluidized Bed;
  • Entrained Flow;
  • Indirect.

The Fixed Bed Gasifiers represent the most consolidated technology thanks to their constructional simplicity, although some difficulties to maintain a uniform temperature along the reactor may arise. These latter involve a series of problems due both to the control system and the quality of the produced syngas. The fixed bed gasifiers are generally used for small-medium size plants (no more than 10-15 tons/hours of biomass). The scaling up to higher potential is very complex because of the impossibility of having a uniform temperature distribution in great size beds.

Depending on the point of product gas intake, different geometries can be classified:

  • Updraft (counter-current);
  • Downdraft (co-current);
  • Crossdraft (cross-current).

The main fixed-bed gasification technologies are known as Lurgi process [4], British Gas Lurgi (BGL) process [5], Wellman-Galusha (WG) process [6] and 100 Ruhr process [7].

Immagine4

Figure 2 – Fixed Bed Gasifiers: Updraft Gasifier (a), Cross Draft Gasifier (b), Down Draft Gasifier (c) [8]


The Fluidized Bed Gasifiers use, together with the feed, an inert material as sand or dolomite. It promotes the mixing, the kinetics and the heat exchange between the biomass particles improving the gasifier efficiency. A periodic sand replacement is required mostly in presence of biomass  as fuels, in order to avoid the risks of bed agglomeration. The fluidizing agent, usually air also containing steam, is generally added in various steps. Primary air is fed to the bottom of the bed in order to achieve the minimum fluidization velocity of the solid material, also visible in the formation of bubbles in the sand. In fact the beds operating in close proximity to the minimum fluidization velocity are denominated Bubbling Fluidized Bed (BFB).

When the air velocity is increased above these values, there is a particles entrainment, which makes necessary the installation of a cyclone for the reintroduction of the solid particles inside the reactor. This configuration is called Circulating Fluidized Bed (CFB)[9].

In air(or oxygen)-fed fluidized bed reactors, the syngas methane content is relatively low because the reactor operates as an high temperature autothermal reformer.

Immagine5

Figure 3 – Bubbling Fluidized Bed Gasifier (a) and Circulating Fluidized Bed Gasifier (b) [10]


The Entrained Flow Gasifiers accept gaseous, pulverized or slurry feeds. The fuel is fed inside burners in co-current with oxygen and eventually steam. In case of biomass as feed, this must be pulverized or submitted to a preliminary pyrolysis step. The gasification process takes place at temperatures about 1200°C and pressures above 20 bar. These operating conditions lead to a non-leachable molten slag and a very low TAR content syngas production with consequent simplification of the downstream purifying operations. The high operating pressure results in the production of a compressed syngas that can be used directly in synthesis reactions. The high temperature makes necessary an heat recovery from the gases through the coupling with steam and electricity production, in this way it is reached  an important improvement in the process efficiency.

Immagine6

Figure 4 – Entrained Flow Gasifier [11]


In the Indirect Gasifiers, gasification occurs in absence of oxygen therefore without feed combustion. For this reason, the heat required by endothermic reactions must be supplied from outside with steam as gasifying agent. In this configuration, the additional heat can obtained by exploiting an external source or by burning a part of the feed in a separated combustion chamber. The necessary heat amount can be supplied in different ways:

  • Direct transfer to the gasification environment;
  • Increase of the steam quantity or degree of overheating;

Both the equilibrium thermodynamic laws and experimental data prove that, using steam as gasifying agent rather than air or oxygen at temperatures in the range of 800-900°C, the methane content grows significantly.


4. Environmental and economical benefits of gasification

The great and obvious potential of gasification process is mainly linked to the use of  syngas for the production of chemicals such as methanol and fertilizers. Additionally,  in some cases the gasification can have the same purpose (i.g. heat and electricity generation) and the same feed typology of incineration process with benefits mainly related to environmental and economic aspects. The gasification of solid fuels normally used for power production (coal, MSW etc.) allows a considerable pollutants reduction such as SOx, NOx and Hg as well as CO2, which is a major cause of global warming. As regards the CO2, some studies have been performed to compare the  gasification-based power plant emission with a combustion-based subcritical pulverized coal plant [12]. The obtained results show how the use of gasification slightly reduces the CO2toEnergy-ratio (745 g/KWh against 770 g/KWh) but an important advantage lies in an easier CO2 capture, being more concentrated in the exhaust gas. On the other hand the gasification allows an easier sulphur and nitrogen removal. In fact, while with the combustion there is the formation of SOx end NOx which are relatively difficult to remove,  gasification produces different substances: the 93-96% of the sulphur is transformed into H2S and the remaining in COS [13], while nitrogen forms N2 and NH3 that is removed during syngas cleaning. The H2S can be removed by absorption producing elemental sulphur as a valuable by-product, saleable to  fertilizers companies. Furthermore, inside the gasifiers dioxins and furans formation is unflavoured and it is possible a significant particular matter reduction with proper treatment. Unlike ash produced with the incineration process, with gasification the slag can be used in roads bed construction.

Table 1 shows how gasification process approaches natural gas emissions.

Immagine7

Table 1 – A comparison of emissions from electricity-generation technologies [14]


5. Gasification industry

The Gasification Technologies Council has been realized some important researches to analyse the gasification plants industrial development, which are summarised in graphs available at: www.gasification.org.

Some of them are listed below (Figure 6, 7, 8). By looking at the global market, the gasification in Asia/Australia exceeds the amount related to the other continents put together due to the important growth of chemical, fertilizer and coal to liquids industries in Asia (Figure 6). On the other hand, the countries with large natural gas reserves invest less in this technology. For example in Russia gasification plants are not currently present, while China represents the most relevant investor in this field with the highest number of gasification plants (Figure 7). In conclusion, Figure 8 shows clearly that coal represents the present as well the future of gasifier feedstock.

Immagine8

 Figure 5 – Gasification capacity by geographic region


Immagine9

 Figure 6 – Map of Gasification Facilities

Immagine10

 Figure 7 – Number of gasifiers primary feedstock


[1] R.C. Brown 2003, Blackwell Publishing, Ames, IA
[2] R.C. Brown 2011, Thermochemical Processing of Biomass, Wiley
[3] R.C. Brown 2003, Blackwell Publishing, Ames, IA
[4] He et al. 2013, Applied Energy, Elservier
[5] R.W. Breault 2010, Energies, 3, pp. 216-240
[6] J.G. Speight  2013, Coal-Fired Power Generation Handbook, Wiley
[7] C. Higman and M. Burgt 2008, Gasification, Elsevier
[8] www.gekgasifier.com
[9] P.Basu 2006, Combustion abd Gasification in Fluidized Beds, CRC Press
[10] www.soi.wide.ad.jp
[11] www.soi.wide.ad.jp
[12] Termuehlen and Emsperger 2003, p.23
[13] Van Loo and Koppejan 2008, p. 295
[14] Recompiled from graphs by Stiegel, 2005