Current Situation of Emerging Technologies for Upgrading Heavy Oils

Author: Marcello De Falco, Associate Professor, University UCBM – Rome (Italy)


1.Theme description

The change in the average crude oil quality due to the scarcity of light oil reserves and to the increase of the use of shale oil, oil sand and bitumen is causing significant troubles to refineries, which are obliged to accept heavier feeds with very different physical properties (lower API gravity, higher amount of impurities). This has stimulated the development of new technology for upgrading the heavy and extra-heavy oils in order to improve their characteristics and, consequently, the refineries performance.

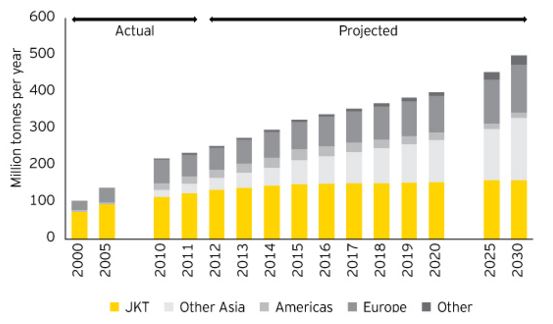
Heavy oils are classified as oil with a API gravity within the range 10°- 22°, whereas extra-heavy oils have a API gravity < 10°. Heavy oils and bitumen reserves geographical distribution is reported in Table 1 [1]: these reserves are continuously increasing, replacing the light oil ones, and Oil&Gas companies found and developed competitive solutions to extract and treat these oils.

tab
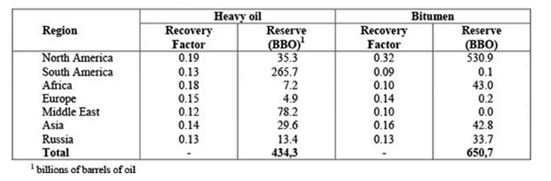
Table 1 – Geographical distribution of heavy oil and bitumen reserves.


Clearly, there is the need to upgrade the heavy oils before feeding to the refineries, in order to improve the downstream products quality and to increase the topping distillate flows: the conventional upgrading processes include carbon rejection and hydrogen addition technologies. But, when the properties of the heavy and extra-heavy oils are critical, more effective solutions are needed to make the oil suitable for refineries feedstock. For this reason, researchers and industries are proposing a number of innovative solutions and some of them are already in the full-scale demonstration phase.

In the following, some of these new emerging oil upgrading configuration are presented. For a complete list of developed technologies, the author suggests the Castaneda, Munoz and Ancheyta review paper[2], which includes the description and comparison of 23 new processes.


2.Heavy-to-Light heavy oil upgrading process

The Heavy-to-Light (HTL) process is patented by Ivanhoe Energy[3], a company recently acquired by FluidOil[4].

The process is based on a circulating transport bed of hot sand to heat the heavy feedstock and convert them to lighter products. Then the upgraded products and the sand are separated in a cyclone and the products are quenched and routed to the atmospheric distillation unit.

The main benefits of the HTL configuration are that it can be integrated at the well-head and it is simple and cheap. The drawbacks are the large dimension of the equipment, the low volumetric yield of upgraded crude, the low capacity for extra-heavy oil processing, the high formation of coke and a low sulfur content reduction. At the exit of the upgrading plant, the oil reaches a API gravity of 18-19° and a 100°C kinematic viscosity of 23 cSt.

The technology development has been completed and Ivanhoe Energy is designing industrial plants in Canada, Latin America and the Middle East.

fig1
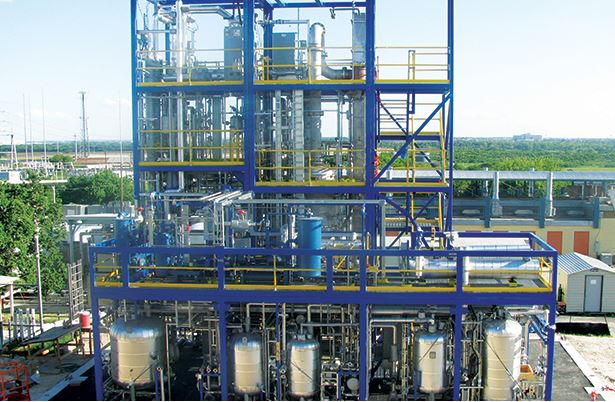
Figure 1 – Ivanhoe Energy’s HTL test facility in San Antonio, Texas[5].


3.HCAT process

HCAT is a catalytic heavy oil upgrading technology developed by Headwaters Technology Innovations Group (HTIG)[6]. The process is composed by a catalytic reactor where a molecule sized catalyst is packed, assuring high conversion of the heavy oil. The main benefits of HCAT configuration are constant product quality, feedstock flexibility and flexible and high conversion (up to 95%).

Neste Oil Corporation’s Porvoo Refinery at South Jordan, Utah, is the first refinery which implements, in 2011, the HCAT heavy oil upgrading technology[7]. More than 500.000 barrels of heavy oil are processed in their upgrading reactors every day and a refinery additional capacity of 200.000 barrels per day has been reached.


4.Viscositor process

Viscositor technology is patented by the Norwegian company Ellycrack AS[8] and it is based on the atomization of the heavy oil by means of a heated sand in a high-velocity chamber. Basically, the process is composed by the following steps (refer to the block diagram shown in Figure 2):

  • sand particles, heated up by coke combustion, are pneumatically conveyed into a collision reactor by means of the hot combustion gases;
  • pre-heated heavy oil is fed to the reactor and collide with the sand particles, evaporating and cracking;
  • the solid particles, the coke generated during the collision process and the oil stream are separated in a cyclone. The solid phase is sent to a regenerator while the oil stream is fed to a dual condensation system. The generated coke is used to supply the heat duty.

The advantages of the process are the low temperature and the low pressure required, almost self-sustained thanks to the coke formation in the reactor and the good quality of the final upgraded oil.

fig2
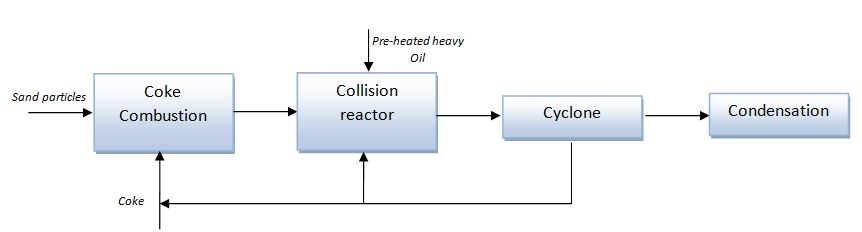
Figure 2 – Block diagram of the Viscositor process


5.IMP process

IMP configuration[9] is a catalytic hydrotreatment-hydrocracking process of heavy oil at mild operating conditions, able to achieve high removal of metals, sulfur compounds, asphaltenes and a large conversion of the heavier share of the oil stream to more valuable distillates.

The most important characteristic of the IMP process is the low fixed investment required and the low operating costs, with an attractive return of investment.

The IMP technology can be applied both for conversion of heavy and extra-heavy oils to intermediate oils and as a first processing unit for heavy and extra-heavy crude oils in a refinery. The final properties of upgraded oils, depending on the heavy oil feedstock, are: API gravity = 22-25°; sulfur content = 1.1 – 1.15 wt%; C7 asphaltenes = 4.7 – 5.3.

A first industrial unit application is being analyzed by Petroleos Mexicanos (PEMEX).


6.Nex-Gen Ultrasound technology

Nex-Gen is an innovative process for heavy oil upgrading which uses ultrasonic waves to break the long hydrocarbon chains and simultaneously adds a hydrogen stream.

Basically, Nex-Gen is a cavitation process: the ultrasonic energy forms cavitation bubbles in the heavy oil stream; then, the bubbles tends to collapse at high temperature and pressure, causing the breaking of the long chain of heavy hydrocarbon molecules.

The next figure shows a scheme of the Nex-Gen configuration.

fig3
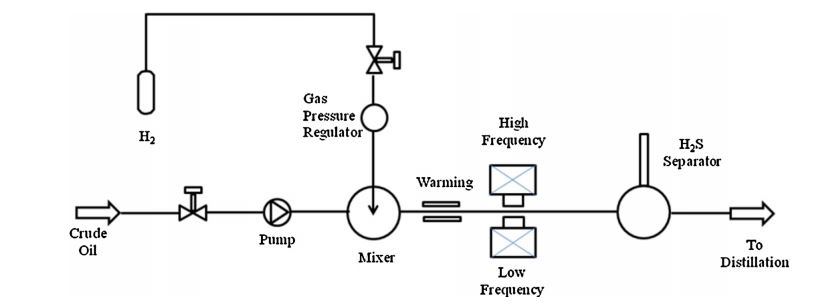
Figure 3 – Scheme of NexGen architecture[10].


A first industrial plant is going to be designed to be integrated near the Athabasca tar sands (Edmonton, Alberta), with a capacity of 10.000 barrels per day. The mild operating conditions (temperature = 0 – 70°C, pressure = 1 – 5 bar) allows a reduction of energy consumption and operating and maintenance costs by 50%.

7.Chattanooga process

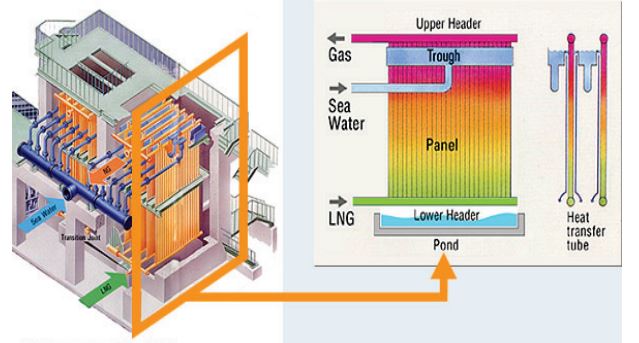
Chattanooga process is a continuous process based on a fluidized bed reactor operating at high pressure and temperature in a hydrogen environment.

The main equipment of the configuration is the pressurized fluid bed reactor and associated fired hydrogen heater. The reactor can continuously convert oil by thermal cracking and hydrogenation into hydrocarbon vapors while removing spent solids[11].

The energy requirements associated with the Chattanooga configuration are significantly reduced in respect to the traditional heavy oil upgrading technologies, as well as operating costs and capital costs.

fig4

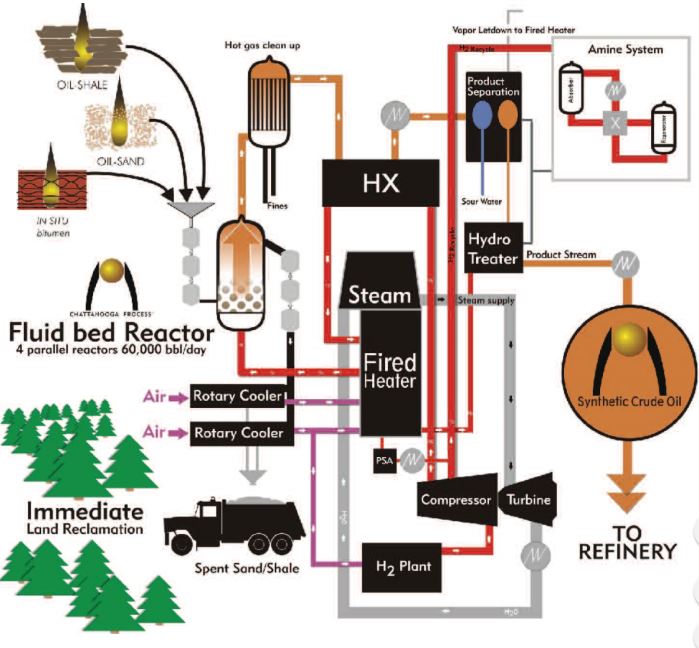
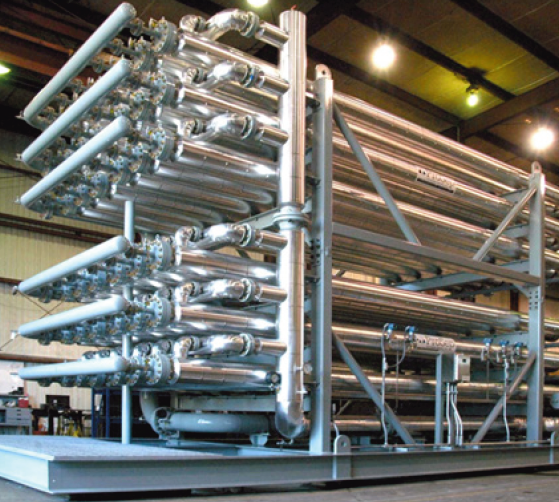
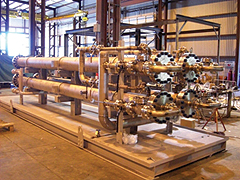
Figure 4 – Chattanooga technology description11.


[1] http://www.scielo.br/scielo.php?script=sci_arttext&pid=S0104-66322014000300001
[2] http://www.sciencedirect.com/science/article/pii/S0920586113002691
[3] Patent No. US 8,105,482 B1 (January 2012).
[4] http://www.marketwired.com/press-release/fluidoil-completes-acquisition-of-ivanhoe-energy-2111300.htm
[5] http://www.albertaoilmagazine.com/2014/04/beyond-diluent/
[6] Patent No. US 7,578,928 B2 (August 2009),
[7] http://www.greencarcongress.com/2011/01/neste-oil-implementing-headwaters-hcat-heavy-oil-upgrading-technology-at-porvoo-refinery.html
[8] Patent No. US 6,660,158 (December 2003).
[9] Patent No. US 7,651,604 B2 (January 26, 2010).
[10] http://www.pedcous.com/business technology upgrading.html, Heavy to light upgrading project, Revolutionary upgrading technology converting extremely heavy crude oil to light sweet crude oil.
[11] http://www.chattanoogaprocess.com/documents/Chattanooga_Process.pdf


Sealing Materials for Well Integrity

Author: Marcello De Falco, Associate Professor, University UCBM – Rome (Italy)


1.Theme description


Well integrity is defined in the NORSOK D-010[1] (a functional standard which fixes minimum requirements for equipments of the oil and gas production wells) as “application of technical, operational and organizational solutions to reduce risk of uncontrolled release of formation fluids throughout the life cycle of a well“.

Basically, technologies for well integrity include many aspects about well operating processes, well services, tubing and wellhead integrity, safety system testing, etc..

Clearly, production tubes have the greatest probability of failure since they are exposed to corrosive elements from the produced fluids. Moreover, the production tubing consists of many connections, which are points of weakness with high risk of leak. International standards impose the installation of two well barriers between the reservoirs and the environment in order to prevent the loss of containment.

In this paper, among the components of the production tube sealing system installed to avoid fluid losses, the innovative sealing materials are assessed and compared.

The most common used sealing material is the cement, which is a fully known and cheap materials. But, there are many properties not ideal for handling well integrity issue as, for example, gas migration through its structure, long term degradation due to temperature and chemical substances exposure, shrinking, etc.

The following figure shows the main problem in applying cement as sealing material in well casing[2].


fig 1


Figure 1 – Cement technical drawbacks in sealing application2: a), b), f) leak paths due to poor bonding between cement and casing/formation; c) fluids migration due to cement fracturing; d) leakages occurring for casing failure; e) flow path through the cement layer due to gas migration during hardening.


For this reason, alternative materials for sealing are studied in order to overcome the issues related to the cement application.

Such materials have to assure a series of properties, among which:

  • low permeability;
  • capacity of bonding to the casing and to the borehole;
  • pumpable without excessive costs;
  • chemically inert and not-reactive with chemical substances present in the formation;
  • self-levelling in the well;
  • safe to be handled and cheap.

An exhaustive list of the most interesting alternative materials is reported in 2. In the following, the most interesting ones (ThermaSet, Sandaband and Ultra Seal) are presented and described.


2.ThermaSet


ThermasetR is a polymeric based resin used to solve a series of well integrity issues, as lost circulation, compromised wellbore integrity, plug and abandonment, and the remediation of sustained casing pressure[3],[4].

As a liquid, ThermaSet is easily pumped and injected since it not contains solid particles. However, particles can be added to accurately modulate the liquid density.

Compared to cement, ThermaSet has a higher compressive and tensile strength, thus improving the sealing material mechanical properties and its behavior under the variable loads which could be caused by pressure and temperature cycles that cause the casing to expand and contract, exerting a force on the annulus material.

In the following table, the ThermaSet and a typical cement (class G Portland) properties are compared[5],[6], attesting the improved characteristics of the innovative material.


tab

Table 1 – Mechanical properties comparison between ThermaSet and Portland cement.


The excellent properties of the material are maintained over time, without showing significant decays: Figure 2 shows the compressive strength value after 1 year under a crude oil pressure equal to 500 bar, demonstrating that its value stabilizes at a value within the range 40-45 MPa6.


fig 2

Figure 2 – ThermaSet compressive strength evolution over time after long-term exposure to crude oil at 500 bar.

Moreover, various experimental tests demonstrated that ThermaSet has, also for long-term test, a low permeability[7].


3.Sandaband

Sandaband is a patented material[8], owned by Sandaband Well Plugging (SWP), consisting of 70% to 80% quartz solids with a variable grain size diameter (between 1 µm and 2 mm)[9]. The rest of the volume is composed by water and chemicals that make the material easily pumpable.

All materials composing Sandaband are chemically stable, with no degradation over time or reaction with other chemicals.

An important property is that Sandaband behaves like a Bingham plastic material, characterized by the fact that it needs a shear stress to start flowing and then has a linear dependence between shear stress and strain, thus allowing that the materials quickly form a rigid body as the pumping is stopped (refer to Figure 3).


fig3


Figure 3 – Bingham liquid behaviour compared to a Newtonian fluid.


Sandaband has a series of unparalleled properties, making it excellent for the application of sealing material for well integrity[10]:

  • Long term integrity
  • Bonds to steel
  • Removable
  • Ductile
  • Non shrinking
  • Cost effective
  • Chemically inert
  • Gas-tight
  • Pumpable
  • Environmentally safe
  • No health hazards
  • Verifiable
  • HPHT resistant
  • No reservoir damage
  • Non-erosional


Tests demonstrated the long-term integrity in the temperature range -10°C to 250°C, the low permeability under operating conditions, the absence of effects on the gas- tightness for casing moving and vibration.


fig4

Figure 4 – Sandaband handling.


The innovative materials has been tested on field for a Temporary P&A (Plug and Abandonment) (BP Norway Ula Well 2007) and for a Permanent P&A (Det Norske Oljeselskap).


4.Ultra Seal

Ultra Seal, developed by CSI Technologies[11], is a material composed by a resin and a hardener, modulated to make the sealant pumpable. Resin and hardener are mixed on the surface in a conventional mixing equipment and clean-up is with a minimal quantity of a methanol and water mixture.

Ultra-Seal R is liquid, thus permitting a more precise mixing than Portland cement.

The material is characterized by low permeability and excellent mechanical properties.


fig5
Figure 5 – Ultra Seal


[1] https://www.standard.no/en/sectors/energi-og-klima/petroleum/norsok-standard-categories/d-drilling/d-0104/

[2] Dickson Udofia Etetim, ” Well Integrity behind casing during well operation.Alternative sealing materials to cement”, Norwegian University of Science and Technology, Department of Petroleum Engineering and Applied Geophysics

[3] http://www.wellcem.no/thermaset-sup-sup-

[4] http://www.wellcem.no/diverse/Brochure.pdf

[5] Wellcem AS. ThermaSet Test Report, 2001.

[6] https://www.norskoljeoggass.no/Global/Presentasjoner/PAF%20Workshop/9%20-%20WellCem%20%20-%20Colin%20Beharie.pdf

[7] http://www.diva-portal.org/smash/get/diva2:565974/FULLTEXT01.pdf

[8] U. .S Patent # 6,715,543; U.S. Patent # 7,258,174

[9] http://www.sandaband.com/modules/m02/article.aspx?CatId=56&ArtId=6

[10] http://www.norskoljeoggass.no/PageFiles/10706/7%20Sandaband%20-%20Non%20consolidating%20plugging%20material.pdf

[11] http://csi-tech.net/documents/csi-resin-sealant.pdf#search=”Ultra Seal”


Solar Refinery

Author: Vincenzo Piemonte, Associate Professor, University UCBM – Rome (Italy) 


1.Theme description


The purpose of a solar refinery is to enable an energy transition from today’s ‘fossil fuel economy’ with its associated risks of climate change caused by CO2 emissions, to a new and sustainable ‘carbon dioxide economy’ that instead uses the CO2 as a C1 feedstock, together with H2O and sunlight, for making solar fuels.


Fig.1 - Scheme Futuristic solar refinery

Figure 1 – Scheme of a  ‘solar refinery’ for making fuels and chemicals from CO2, H2O and sunlight[1]


On an industrial scale, one can visualize a solar refinery (see Figure 1) that converts readily available sources of carbon and hydrogen, in the form of CO2 and water, to useful fuels, such as methanol, using energy sourced from a solar utility. The solar utility, optimized to collect and concentrate solar energy and/or convert solar energy to electricity or heat, can be used to drive the electrocatalytic, photoelectrochemical (PEC), or thermochemical reactions needed for conversion processes. For example, electricity provided by PV cells can be used to generate hydrogen electrochemically from water via an electrocatalytic cell.

However, hydrogen lacks volumetric energy density and cannot be easily stored and distributed like hydrocarbon fuels. Therefore, rather than utilizing solar-generated hydrogen directly and primarily as a fuel, its utility is much greater at least in the short to intermediate term as an onsite fuel for converting CO2 to CH4 or for generating syngas, heat, or electricity.  Reacting CO2 with hydrogen not only provides an effective means for storing CO2 (in methane, for example), it also produces a fuel that is much easier to store, distribute, and utilize within the existing energy supply infrastructure.

The idea of converting CO2 to useful hydrocarbon fuels by harnessing solar energy is attractive in concept. However, significant reductions in CO2 capture costs and significant improvements in the efficiency with which solar energy is used to drive chemical conversions must be achieved to make the solar refinery a reality.


Fig.2 - Schematic Diagram

Figure 2 – Schematic diagram of integrated PV-Hydrogen utility energy system


Solar energy collected and concentrated within a solar utility can be harnessed in different ways: (1) PV systems could convert sunlight into electricity, which in turn, could be used to drive electrochemical cells that decompose inert chemical species such as H2O or CO2 into useful fuels (see figure 2); (2) PEC or photocatalytic systems could be designed wherein electrochemical decomposition reactions are driven directly by light, without the need to separately generate electricity; and (3) photothermal systems could be used either to heat working fluids or help drive desired chemical reactions such as those connected with thermolysis, thermochemical cycles, etc. (see Figure 3). Each of these approaches can be used to generate environmentally friendly solar fuels that offer “efficient production, sufficient energy density, and flexible conversion into heat, electrical, or mechanical energy”[2]. The energy stored in the chemical bonds of a solar fuel could be released via reaction with an oxidizer, typically air, either electrochemically (e.g., in fuel cells) or by combustion, as is usually the case with fossil fuels. Of the three approaches listed here, only the first (PV and electrolysis cells) can rely on infrastructure that is already installed today at a scale that would have the potential to significantly affect current energy needs. In fact, the PEC and photothermal approaches, though they hold promise for achieving simplified assembly and/or high energy conversion efficiencies, require considerable development before moving from the laboratory into pilot-scale and commercially viable assemblies.


Fig.3 - Solar Driven

Figure 3 – Solar-Driven, Two-Step Water Splitting to Form Hydrogen Based on Reduction/Oxidation Reactions


2.Carbon Dioxide-derived fuels

The CO2 concentrations in the atmosphere are still low enough (0.04%) that it would be impractically expensive to capture and purify CO2 from the atmosphere, but other sources of CO2 are available that are considerably more concentrated. Power generation based on natural gas or coal combustion is responsible for the major fraction of global CO2 emissions, with other important sources being represented by the cement, metals, oil refinery, and petrochemical industries[3]. Indeed, a growing number of large-scale power plant carbon dioxide capture and storage (CSS) projects are either operating, under construction, or in the planning stage, some of them involving facilities as large as 1,200 MW capacity[4]. While solar PV energy conversion has the potential to reduce CO2 emissions by serving as an alternative means of generating electricity, harnessing solar energy to convert the CO2 generated by other sources into useful fuels and chemicals that can be readily integrated into existing storage and distribution systems would move us considerably closer to achieving a carbon-neutral energy environment.

Herron et al.[5], in a very recent review, examine the main routes for CO2 capture from stationary sources with high CO2 concentrations derived from post-combustion, precombustion, and oxy-combustion processes.

In post-combustion, flue gases formed by combustion of fossil fuels in air lead to gas streams with 3%–20% CO2 in nitrogen, oxygen, and water. Other processes that produce even higher CO2 concentrations include pre-combustion in which CO2 is generated at concentrations of 15%–40% at elevated pressure (15–40 bar) during H2 enrichment of syngas via a water–gas shift reaction (WGS — see Figure 1) and oxy-combustion in which fuel is combusted in a mixture of O2 and CO2 rather than air, leading to a product with 75%–80% CO2. CO2 capture can be achieved by absorption using liquid solvents (wet-scrubbing) or solid adsorbents.

In the former approach, physical solvents (e.g., methanol) are preferred for concentrated CO2 streams with high CO2 partial pressures, while chemical solvents (e.g., monoethanolamine -MEA) are useful in low-pressure streams.

Energy costs for MEA wet-scrubbing are reportedly as low as 0.37–0.51 MWh/ton CO2 with a loading capacity of 0.40 kg CO2 per kg MEA. Disadvantages of this process are the high energy cost for regenerating solvent, the cost to compress captured CO2 for transport and storage, and the low degradation temperature of MEA. Alternatives include membrane and cryogenic separation. With membranes there is an inverse correlation between selectivity and permeability, so one must optimize between purity and separation rate.

Cryogenic separation ensures high purity at the expense of low yield and higher cost. Currently, MEA absorption is industrially practiced, but is limited in scale: 320–800 metric tons CO2/day (versus a CO2 generation rate of 12,000 metric tons per day for a 500 MW power plant). Scale-up would be required to satisfy the needs of a solar refinery.

Alternatives, such as membranes, have relatively low capital costs, but require high partial pressures of CO2 and a costly compression step to achieve high selectivity and rates of separation.

A very important point to consider about solar refinery reliability is that since carbon capture reduces the efficiency of power generation, power plants with carbon capture will produce more CO2 emissions (per MWh) than a power plant that does not capture CO2. Therefore, the cost of transportation fuel produced with the aid of CO2 capture must also cover the incremental cost of the extra CO2 capture[6]. These costs must then be compared to the alternative costs associated with large-scale CO2 sequestration. Finally, one also needs to consider the longer-term rationale for converting CO2 to liquid fuels once fossil-fuel power plants cease to be major sources of CO2. Closed-cycle fuel combustion and capture of CO2 from, e.g., vehicle tailpipes, presents a considerably greater technical and cost challenge than capture from concentrated stationary sources.


3.Challenges & Opportunities

Christos Maravelias and colleagues from the University of Wisconsin have recently modeled and analyzed the energy and economic cost of every step and each alternative technology contained in a solar refinery[7]. The result is a general framework that will allow scientists and engineers to evaluate how various improvements in materials’ manufacturing and processing technologies that enable carbon dioxide capture and conversion to fuels using solar, thermal and electrical energy inputs would accelerate the development, influence the cost and impact the vision of the solar refinery. It will also enable evaluation of which alternative technologies are the most economically feasible and should be targeted or highlight those that even if developed would still be hopelessly uneconomic and can therefore be ruled out immediately.

The view that emerges from this techno-economic evaluation of building and operating a solar refinery is one of guarded optimism. On the subject of energy efficiency, it is clear that solar powered CO2 reduction is currently lagging far behind that of solar driven H2O splitting and more research is needed to improve the activity of photocatalysts and the efficacy of photoreactors. In the indirect process of transforming CO2/H2O to fuels, it is apparent that if the currently achievable solar H2O-to-H2 conversion (>10%) can be matched by solar CO2/H2-to-fuel conversion efficiencies, through creative catalyst design and reactor engineering, this would represent a promising step towards an energetically viable solar refinery. For the process that can directly transform CO2/H2O to fuels, improvements in conversion rates and product selectivity are key requirements for achieving energy efficiency in the solar refinery.

Economic efficiency is also a key to the success of the solar refinery of the future. For currently achievable CO2 reduction rates and efficiencies, the minimum selling price of methanol, a representative fuel, was evaluated by the techno-economic analysis and turned out to be more than three times greater than the industrial selling price analysis, even though the cost of the CO2 reduction step, which is estimated to be quite costly, was not included in the estimates. Improvement in the activity of CO2 reduction photocatalysts by several orders of magnitude would have a significant impact on the energy and economic costs of operating a solar refinery.

It is clear that the cost and energy efficiency of carbon capture and storage is an area where big improvements need to be made if the solar refinery is to be a success.  One other point that is worth highlighting is the availability of water, since in some parts of the world the availability of water could be a big problem to face up.

To conclude, multidisciplinary teams of materials chemists, materials scientists, and materials engineers across the globe believe in the dream of the solar refinery and a sustainable CO2 based economy. Anyway it is clear that developing models to evaluate the energy efficiency and economic feasibility of the solar refinery, and at the same time identifying hurdles which have to be surmounted in order to realize the competitive processing of solar fuels, will continue to play a crucial role in the development of the required technologies.


[1] Reproduced from A general framework for the assessment of solar fuel technologies, Energy & Environmental Science, DOI: 10.1039/C4EE01958J with permission of The Royal Society of Chemistry.
[2] Jooss, C. and H. Tributch. “Chapter 47: Solar Fuels” Fundamentals of Materials for Energy and Environmental
Sustainability. D.S. Ginley and D. Cahen, editors. Cambridge University Press. (2011). http://cds.cern.ch/
record/1613941
[3] Carbon Dioxide Emissions. United States Environmental Protection Agency. http://www.epa.gov/climatechange/
ghgemissions/gases/co2.html
[4] http://www.globalccsinstitute.com/projects/large-scale-ccs-projects
[5] Herron, J.A., J. Kim, A.A. Upadhye, G.W. Huber, C.T. Maravelias. “A General Framework for the Assessment of Solar Fuel Technologies.” Energy Environ. Sci. (2015). 8, 126-157.
[6] Randall Field, MIT Energy Initiative, personal communications.
[7] Energy and Environmental Science, 2014, DOI: 10.1039/c4ee01958j


Water Treatment in Unconventional Gas Production

Author: Vincenzo Piemonte, Associate Professor, University UCBM – Rome (Italy)


1.Theme description

 The average $3 million drilling and fracturing process required for each well uses an average of 4.2 million gallons of water, much of which has traditionally been freshwater. The volume of water can vary significantly and is highly dependent on the length of the drilled lateral[1].

More than 99 percent of the fracturing fluid is water and sand, while other components such as lubricants and bactericides constitute the remaining 0.5 percent. This fracturing mixture enters the well bore, and some of it returns as flowback or produced water, carrying with it, in addition to the original materials, dissolved and suspended minerals and other materials that it picks up in the shale[2].


fig.1

Figure 1 – Volumetric composition of process water in shale gas production.


Once in production for several years, natural gas wells can feasibly undergo additional hydraulic fracturing to stimulate further production, thereby increasing the volume of water needed for each well. Approximately 10-25 percent of the water injected into the well is recovered within three to four weeks after drilling and fracturing a well. Water that is recovered during the drilling process (drilling water), returned to the surface after hydraulic fracturing (flowback water), or stripped from the gas during the production phase of well operation (produced water) must be properly disposed2.

The recovered water contains numerous pollutants such as barium, strontium, oil and grease, soluble organics, and a high concentration of chlorides. The contents of the water can vary depending on geological conditions and the types of chemicals used in the injected fracturing fluid. These wastewaters are not well suited for disposal in standard sewage treatment plants, as recovered waters can adversely affect the biological processes of the treatment plant (impacting the bacteria critical to digestion) and leave chemical residues in the sewage sludge and the discharge water. Many producers have been transporting flowback and produced water long distances to acceptable water treatment facilities or injection sites. But deep well injection now also meeting challenges.

The water disposal challenge has spurred a new water treatment industry in the region, with entrepreneurs and established companies creating portable treatment plants and other innovative treatment technologies to help manage produced water mainly focuses to water reuse.

fig.2

Figure 2 – Potential beneficial reuses of process water in the oil&gas industry.


2.Water Costs and Quality Concerns

Dealing with water scarcity and wastewater (i.e., brine) quality are top priorities in shale and tight gas production. Doing this requires water reuse technology that reduces the waste stream by efficiently separating out salts, heavy metals and nutrients to produce recovered water. Effective filtration must eliminate suspended solids from salt water going to deep well injection.

Cost can be an overriding factor in water treatment and processing decisions. There certainly are  environmental considerations involved in using chemicals to perform operations such as frac- water treatment or salt removal and recovery. However, the cost of mitigating chemistry also comes into play. Chemical friction reducers make source water slicker for faster pumping, and then specialty chemicals like biocides, which kill microorganisms, and scale inhibitors, which control deposits, are added to the water. Mobile ultrafiltration technology can reduce the need for biocides – and the cost of treatment.

Slick water fracturing and horizontal drilling were revolutionary developments that made it economically viable to extract unconventional gas on a grand scale. Fracturing lowered the cost of moving the gas to the well bore, while horizontal drilling – which covered a vastly greater expanse of territory than a single vertical probe – exponentially increased the amount of gas that could be withdrawn. It became much more profitable to put wells into shale gas formations, but the cost of doing that business today depends, in no small part, on what ultimately happens to the brine. That, in turn, depends on geography. Chemical treatment is not the challenge so much as affordability; most brine is just discharged to disposal wells, but the fewer of these wells there are, the greater the production expense incurred, and in some parts of the country, geology or the lack of water makes disposal wells unfeasible.

In geographical areas, like Pennsylvania where there are major shale gas deposits, where the geology won’t allow disposal wells, the brine has to be trucked out for disposal elsewhere or cleaned for reuse or discharge. Not only is transportation potentially dangerous, it’s also expensive; trucking the frac-water from eastern Pennsylvania to Ohio for deep well disposal costs from $1.50 to $2.00 per barrel to dispose of produced water at the injection well plus getting the wastewater to the injection well requires many trucks each costing about $100/hour on an estimated six-hour typical trip in eastern Pennsylvania. Evaporation and crystallization technologies can recover almost all of the produced water as pure distilled water and create a salable salt product for uses such as road de-icing or grey water softening, but that adds another, higher level of costs. In the West, where water often can be inexpensive but scarce, it makes much more economic sense to clean up the wastewater and then sell it for land application[3].


3.Guidelines for technology selection

 In order the select the more suitable technology for water treatment there are issues related to the condition, as well as the cost, of water that must be addressed. Here are some of the principal ones:

  • Most surface water used for fracking is fresh water, and this surface water has variable quality, so ultrafiltration is an effective way to treat this influent source.
  • Bacteria, corrosion and the buildup of solids in storage tanks are problems for disposal well management to solve.
  • While technical obstacles involved in salt concentration can be overcome through membrane and thermal processes, chemical pre-treatment to remove oil and grease from the brine before it passes through the membranes is a challenge on a case-by-case basis.
  • Reuse and recovery options make unconventional gas development sustainable, but they also involve handling more wastewater, so integrated discharge water management and reuse solutions are necessary for safe and efficient treatment and recycling.
  • The presence of Naturally Occurring Radioactive Materials, or NORMs, in frac flowback and produced water can contaminate the salt product created by crystallization. Pretreatment of brine can remove NORMs such as radium.
  • Brine disposal into evaporative and wastewater ponds is getting a great deal of critical attention, so it is important to put a cleaner disposal product into the ponds or somehow reduce industry dependency upon them.
  • Because industry operators do not just stay in fixed locations, but frequently move from site to site to drill the most promising gas plays, water treatment systems should be mobile[4].


4.Some Research Project

While progress has been made on the water quantity and quality impacts of shale gas development, challenges remain, including the potential cumulative long-term water impacts of the industry. Therefore, additional water research and environmental policy changes will be necessary in order to fully realize the economic opportunity of the region’s natural gas wealth while safeguarding the environment.

In the following there are reported some interesting research project focused on water reuse.


Project 1: Advancing a Web Based Decision Support Tools (DST) for Water Reuse in Unconventional O&G Development[5]

The objective of this project is the development of database and a decision support tool (DST) selecting and optimizing water reuse options for unconventional O&G development with a focus on Flowback and Produced Water Management, Treatment and Beneficial Use for Major Shale Gas Development Basins.

  • Funding agency: US DOE-RPSEA
  • Start date: 1/2012
  • End date: 1/2016
  • Funding: $286,984


Project 2: Engineered Osmosis for Advanced Pretreatment of O&G Wastewater[6]

The objective of this project is further develop and optimize engineered osmosis membranes and systems for treatment of unconventional O&G wastewater (see figure 3). As main project outcomes there are:

  • Field test the engineered osmosis process on drilling and produced waters in the DJ Basin
  • Develop process design tools and life cycle assessment
  • Funding agency: US DOE-RPSEA
  • Start date: 9/2011
  • End date: 6/2015
  • Funding: $1,323,805

fig.3

Figure 3 – Engineered osmosis process scheme


Project 3: Advanced Biological Pretreatment[7]

The objective of this project is the development and evaluation of cost-effective pre-treatment technologies for O&G wastewater with emphasis on biological filtration. The  major outcomes and outputs are the substantial removal of dissolved organic carbon (96%) and chemical oxygen demand (89%) in produced water from the Piceance and Denver-Julesburg basins

  • Funding agency: NSF/SRN
  • Start date: 10/2012
  • End date: 9/2017
  • Funding: $1,400,390 to CSM


[1] Yoxtheimer, Dave. “Potential Surface Water Impacts from Natural Gas Development.” pg.5. http://www.marcellus.psu.edu/resources/PDFs/Halfmoon%208-­‐24-­‐11.pdf
[2] Hammer, Rebecca and Jeanne VanBriesen. “In Fracking’s Wake: New Rules are Needed to Protect Our Health and Environment from Contaminated Wastewater,”pg. 11. May 2012. http://www.nrdc.org/energy/files/Fracking-­‐Wastewater- FullReport.pdf
[3] July 2011, Journal of Petroleum Technology, p. 50, “Flowback to Fracturing: Water Recycling Grows in the Marcellus Shale”, by Stephen Rassenfoss, JPT Online Staff Writer
[4] https://www.gewater.com/kcpguest/document-library.do/
[5] http://aqwatec.mines.edu/produced_water/tools/
[6] http://aqwatec.mines.edu/produced_water/tools/
[7] http://aqwatec.mines.edu/produced_water/tools/


Thin Film Membrane Technology: Advances in Natural Gas Treatment

Author: Marcello De Falco, Associate Professor, University UCBM – Rome (Italy)


1. Theme description

Natural gas (NG) treatments are the processes needed to sweeten and purify the extracted NG before feeding it to the grid. Such processes are crucial to reach the gas purity targets and constitute a large fixed and operative costs for the NG production sector.

The main components to be removed in the NG purification process are the acid gases as carbon dioxide (CO2) and hydrogen sulphide (H2S) and, in many cases, the nitrogen (N2).

As reported in the following table, the contents of such components in the extracted NG stream can be high, leading to challenging and expensive separation processes.

  Groningen

(Netherlands)

Laeq

(France)

Uch

(Pakistan)

Uthmaniyah

(Saudi Arabia)

Ardjuna

(Indonesia)

CH4 81.3 69 27.3 55.5 65.7
C2H6 2.9 3 0.7 18 8.5
C3H8 0.4 0.9 0.3 9.8 14.5
C4H10 0.1 0.5 0.3 4.5 5.1
C5+ 0.1 0.5 1.6 0.8
N2 14.3 1.5 25.2 0.2 1.3
H2S 15.3 1.5
CO2 0.9 9.3 46.2 8.9 4.1
Table 1 – Composition of natural gas reservoirs (%vol)[1]


Traditionally, the separation is carried out by means of:

1-Absorption processes, by which the components to be separated are absorbed on a liquid solvent in a packed column and then separated in the solvent regeneration step. The absorption of the component on the solvent can be chemical (chemical absorption) or physical (physical absorption). A wide applied absorption industrial process is the ammine separation (MDEA) unit for acid gases removal[2].

2- Adsorption processes, where selected components are adsorbed on the solid surface of specific particles. Then, increasing the solid bed temperature (Thermal Swing Adsorption – TSA) or reducing the pressure (Pressure Swing Adsorption – PSA), the gas is extracted and the solid is regenerated. The most applied adsorption process is the PSA, used to remove CO2 from natural gas streams by solid materials with a high affinity to carbon dioxide[3].

3- Cryogenic processes, known as low temperature distillation, which uses a very low temperature for purifying gas mixtures in the separation process exploiting the different gas components volatility. It is not applied for the acid gas removal from natural gas due to the low concentrations needed that makes the application of this technique not economical.But, a growing interest is given to separation processes using selective membranes thanks to their ease of operation, flexibility, smaller footprint and lower capital requirements.Basically, a membrane allows the transfer of certain components but not of the others, thus leading to a separation. A schematic layout is reported in Figure 1.

fig1
Figure 1 – Conceptual layout of a membrane-based separation process, with a membrane selective to component A.

Compared to the other natural gas separation techniques, the membrane process needs a lower energy requirement since it does not involve any phase transformation. Moreover, the process equipment is very simple with no moving parts, compact, relatively easy to operate and control, and also easy to scale-up and scale-down[4].In order to be applied in an industrial process, a selective membrane must have the following properties:

  • high permeability, leading to a high flux of the separated component through the membrane thickness;
  • high selectivity;
  • high mechanical and thermal resistance at the separation unit operating conditions;
  • the chemical resistance in the environment where the membrane is placed;
  • low cost and long durability.

The permeability increases reducing the selective layer thickness, but at the same time, both the selectivity and the mechanical resistance are penalized with thin membranes. Therefore, the membrane design requires an accurate optimization. Usually, the applied membranes are composite and fabricated depositing a thin selective layer on a support able to assure the needed mechanical properties (refer to Figure 2).

fig2
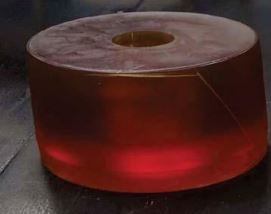
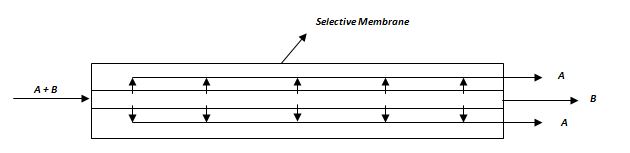
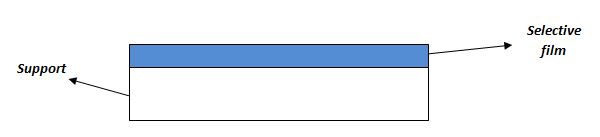
Figure 2 – Composite membrane architecture

In the following, some examples and applications of membrane applications for CO2, H2S and nitrogen removal from natural gas are reported.

2.Membrane application for CO2 removal

Carbon dioxide is the largest contaminant found in natural gas and, for this reason, a strong effort has been devoted to discover solutions to apply selective membranes in the CH4/CO2 separation process.Currently, the only commercial membranes applied for CO2 removal are polymeric, made by cellulose acetate, polyimides, polyamides, polysulfone, polycarbonates and polyetherimide[5]. The most widely used material is cellulose acetate as used in UOP’s membrane systems: the Separex membrane system has been applied in a number of large NG plants installed worldwide (refer to Figure 3)[6],[7]. Another widely applied commercial product is the cellulose tri-acetate (CTA) membrane developed by Cameron and called CYNARA[8]: such a membrane is applied in world’s largest CO2 membrane plant for natural gas clean-up (700 MMcf/d).

Fig.3
Figure 3 – Separex membrane skids installed at an EOR project in Latin America6.

Also Air Liquide has developed a membrane module for the purification of NG by removal of CO2, H2S and water steam[9]. The system is called MEDALTM and is able to reach the pipeline specification of 2 – 5% CO2 and 4 ppm H2S. Moreover, the membrane unit can be also used as a pre-treatment, removing the majority of CO2 and H2S, followed by a typical amine process to further remove carbon dioxide.Another product is proposed on the market by ProSep[10]: the membrane is fabricated in a flat sheet and the arranged into a spiral wound module, then inserted into steel pressure-containing tubes. Such a membrane module has been applied in a number of plants in U.S.A. and Colombia.

Fig.4
Figure 4 – ProSep membrane skid for CO2 removal installed in Texas.

The polymeric materials lead to a good separation performance but are poisoned by aromatics, organic liquid and water. For this reason, pre-treatment units have to be installed before the membrane separation device, leading to an increase of the costs and of the plant complexity.Some innovative membrane technologies have been developed and installed. As an example, the CO2 separation membrane provided by Membrane Technology & Research (MTR)[11] is a new polymeric membrane able to withstand the various components of the NG mixture, thus reducing the impacts of the pre-treatments.

3.Membrane application for H2S removal

On the contrary of the CO2 removal process by means of membranes, which now sees many industrial applications, the removal of H2S is still in a phase of pre-industrial development. The most interesting technologies are developed and tested by Membrane Technology & Research.MTR develops the SourSep™ systems bulk removal of H2S from pressurized sour gas[12]. The proposed architecture is based on a simple single stage process, able, thanks to a proper membrane installation, to assure a bulk removal of H2S (>75%). The permeate stream generated in very sour and can be re-injected in the extraction well or processed in a conventional Claus unit. The retentate stream has to be fed to other H2S removal unit (amine absorption or a scavenger process) to further reduce the sulfur content. Figure 4 shows a SourSep™ installation.

Fig.5
Figure 5 – SourSep™ MTR installation for the removal of H2S.

Another membrane application for H2S removal, always proposed by MTR, is for the achievement of the stringent H2S content target (< 40 ppm) if the NG is fed to an engine or a gas turbine. Such low composition is required to avoid the mechanical components corrosion and damage. A scheme of such a process, proposed by MTR, is illustrated in Figure 6: after the NG compression, a raw gas stream is sent to a first filter and then to the membrane unit, able, also thanks to the high pressure and, consequently, to the large pressure driving force through the membrane, to drastically reduce the sulfur content.

Fig.6
Figure 6 – Process scheme for H2S removal from NG to reach the inlet feedstock quality targets for engines or gas turbines[13].

Also UOP has developed and applied a polymeric membrane for the removal of H2S, testing it in a pilot plant and thus demonstrating the membrane stability at a wide operating conditions range and the proper values of permeability and selectivity.

4.Membrane application for N2 removal

Selective membranes are proposed also for NG denitrogenation but, according to the DOE[14], the challenge of developing competitive membrane for N2/CH4 separation is not yet overcome.Both glassy polymers (nitrogen-permeable) or rubbery polymers (methane-permeable) membranes can be applied. But, while a nitrogen/methane selectivity of 15 at least is required to make the denitrogenation membrane economically competitive, the highest selectivity available with current polymers is only about 2-3. Therefore, strong R&D efforts are required.Some interesting studies can be found in the scientific literature, as the works published by the University of Massachusetts[15] and the Aachen University[16].Currently, MTR and CB&I are the only manufacturers of membranes for nitrogen removal. The membrane module they developed, called NitroSepTM, have been applied for up to 20 MMSCFD NG plants and nitrogen composition up to 15%[17] (refer to Figure 7).

Fig.7
Figure 7 – NitroSepTM module application in California[18].  


[1] Biruh Shimekit and Hilmi Mukhtar, ” Natural Gas Purification Technologies – Major Advances for CO2 Separation and Future Directions”, in Hamid Al-Megren “Advances in Natural Gas Technology”, InTech edition, 2012, p.235-270.
[2] http://www.bre.com/portals/0/technicalarticles/The%20Use%20of%20MDEA%20and%20Mixtures%20of%20Amines%20for%20Bulk%20CO2%20Removal.pdf

[3] Cavenati, S., A. Carlos, et al. (2006). Removal of carbon dioxide from natural gas by vacuum pressure swing adsorption. Energy & fuels, Vol. 20, No. 6, pp. 2648-2659.
[4] Stern, A. (1994). Polymers for gas separations: the next decade. Journal of Membrane Science, Vol. 94, No. 1, pp. 1-65
[5] http://www.membrane-guide.com/download/CO2-removal-membranes.pdf
[6] http://www.uop.com/?document=separex-membrane-systems-brochure&download=1
[7] http://www.uop.com/?document=uop-continued-development-of-gas-separation-membranes-technical-paper&download=1
[8] http://www.c-a-m.com/company/technology-works-here/cynara-membrane
[9] http://www.medal.airliquide.com/en/co-membrane/co-membrane-technology.html
[10] http://prosep.com/wp-content/uploads/2014/03/Gas-Membranes-Technology-Sheet-Letter.pdf
[11] http://www.mtrinc.com/co2_removal.html
[12] http://www.mtrinc.com/h2s_removal.html
[13] Pat Hale, Kaaeid Lokhandwala, “Advances in Membrane Materials Provide New Solutions in the Gas Business”.
[14] http://www.netl.doe.gov/KMD/cds/Disk28/NG8-2.PDF
[15] ttp://www.ecs.umass.edu/che/henson_group/research/membrane/t-04163.pdf
[16] http://www.sciencedirect.com/science/article/pii/S0376738815302374
[17] http://www.cbi.com/technologies/technologies-servicesnitrogen-rejection
[18] http://www.mtrinc.com/pdf_print/natural_gas/MTR_Brochure_Nitrogen_Removal.pdf


Pinch Analysis in the Oil&Gas Industries

Author: Mauro Capocelli, Researcher, University UCBM – Rome (Italy)


1. Theme description

Energy recovery and process integration is the most direct solution if for the increasing of process efficiency. In the industrial processes (in in particular in the chemical and petrochemical sector) the performance improvement is mandatory in order to face the climate change as well as the growing energy crisis. This objective can be achieved by integrating systems for the simultaneous minimization of the objective functions: the investment cost and the energy consumption.

Fig.1

Figure  1 –  Composite curves and Grand composite curve example3


By analysing the heat transfer, the optimal system is the one that balances the two abovementioned functions by identifying the most convenient way to transfer the heat between various fluids in the overall system (in a way compatible with the process control constraints, the need of spaces and the safety risks)[1]. This aspect is complex by its nature since the chances of interconnection in a plant configuration vary with the operating conditions. A systematic approach to this issue is given by Nishida and co-workers[2] that individuated from the theoretical point of view the two main areas of the process integration: the identification of the different possible alternatives and the development of heuristic criteria to discard the worst solutions. The Pinch Analysis (PA) was born from these necessities by some academic works as the one developed in the ETH of Zurich and Leeds University in the 70s[3]. The first systemic essay on the pinch technology was given by Linnhoff[4]. He applied thermodynamic fundamentals for improving the process efficiency, saving energy, reducing the investment cost and optimizing the process control. By analysing the heat flow cascade, Linnhoff defined the pinch point as the temperature level corresponding to a zero heat flux between the hot and cold fluid (Fig. 1) and proposed the graphical approach based on the Grand Composite Curve in order to simply evaluate the pinch and the energy target[5]. His works become the main textbooks on pinch analysis. He also established the Linnhoff March Ltd in 1983 offering process design services to international clients; in 90’ around 80% of all the world’s largest oil and petrochemical companies become its clients or sponsors. The expanded edition of 2006, “Pinch Analysis and Process Integration” is the fundamental book of modern PA[6]. These methods are now recognized also as fundamental for pollution prevention in the view of reusing and reducing the resources as well as optimizing end-of-pipe treatment and disposal[7].


2.Theory and Practice

Intuitively, the main field of application of PA is the optimization of Heat Exchanger Networks (HEN) present in complex systems. The concept, based on the thermodynamic analysis, do not use advanced unit operations for the performancefig 1 bis 
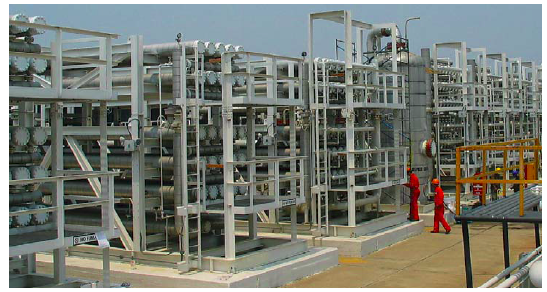
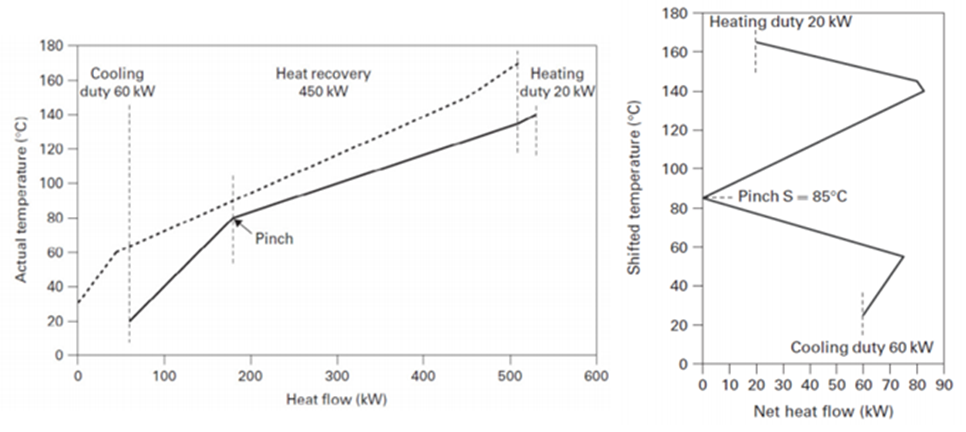
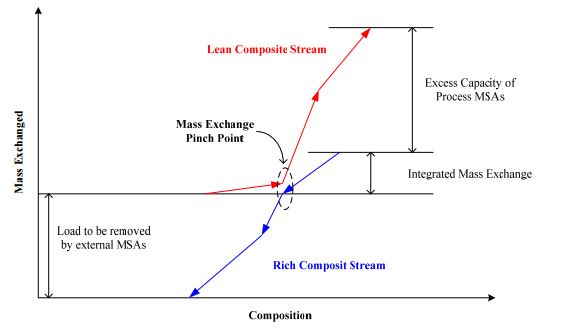
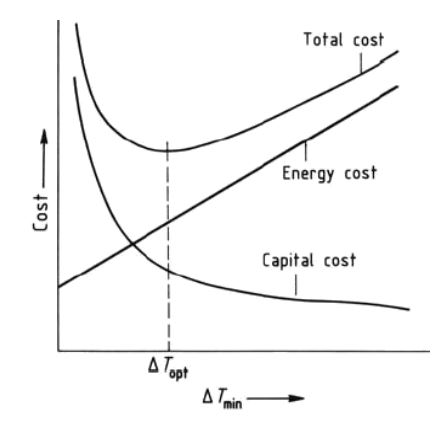
improvement, but has the aim to match the cold and hot process streams with a HEN that minimize the external energy supply. According to the PA fundamentals, the first step is to draw the heating and cooling curves to evaluate the minimum temperature difference ΔTmin and the related energy target corresponding to reasonable values of the temperature differences.

The interval temperatures are used to compose a Grand Composite Curve (GCC) that gives the overall process overview in the temperature and heat flow diagram (Fig. 1). The smaller  ∆Tmin the  more  heat  can  be transferred in the heat exchanger, but this will also lead to larger heat exchanger area which is costly. Hence, choosing an optimal ∆Tmin is possible only by integrating economic considerations.

The diagram is commonly divided into two sub problems defined by the pinch points (i.e. the constrained regions in which there is the minimum temperature difference between the streams). This approach has two main corollaries: do not transfer heat across the pinch; do not use external cooling above the pinch and external heating below the pinch[8] (as visible in Fig. 2).

Fig.2
Figure 2 – The separation of HEN and the main corollary of PA


Globally, the application of Pinch analysis in the process industry is necessary for large, complex industrial facilities, where systematic methods are needed to identify the best opportunities to improve energy efficiency. The typical PA project is based on the fundamental stage of data acquisition (primarily heat loads and temperatures and economic parameters) regarding the process under consideration. Then, the analysis can be directed to:

  • Selecting the best option for reducing the inefficiencies from an economic point of view (e.g. heat transfer units in distillation plants)
  • Generating targets for each utility for high energy efficiency and low emissions (for design and retrofit)
  • Debottlenecking and optimizing the integration of utilities in retrofit design
  • Managing material resources, such as water and hydrogen (“water pinch” and “hydrogen pich”) to minimize the makeup and the discharge (while maximizing the reuse).

This latest aspect can be characterized as the Mass Pinch analysis, developed by Mahmoud M. El-Halwagi, and Vasilios Manousiouthakis[9], consisting in a thermodynamic procedure used to identify the bottlenecks that limit the extent of mass exchange between the rich and the lean process streams (in order to improve the design and minimizing the cost).

mass pinch diagram
Figure 3 – Mass pinch diagram [El-Halwagi, 1998]

3.Applications

Since the Oil & Gas Sector is one of the major energy user and supplier, is highly integrated from the point of view of heating and cooling power and it is, therefore, the optimal candidate for PA.

The group of the Politecnico of Milano developed many strategies based on the PA for the optimal design of steam generators, boilers and heat recovery steam cycles. Their “HRSC Optimizer” has been applied with interesting results on Fischer Tropsch (FT) synthesis processes[10]  (with high recovery of the unconverted gases) as well as integrated gasification combined cycle (IGCC-CCS). Joe and Rabiu improved the existing HEN of a Petroleum refining section revealing a 34% of energy saving by the definition of the optimal utility usage, number and surfaces of the exchangers[11]. Yoon et al., suggested the retrofit of a ethyl benzene plant by PA with a payback time of less than one year and by reducing the opex of more than 5%[12]. The application of PA in the retrofit design of the Tula distillation units is described by Briones in 1999 on the Oil&Gas Journal. The reduction of the fuel consumption by more than 40% (8 M$/year) with a payback period of less than 2 years are among the main claimed results[13]. An integrated design of the atmospheric and vacuum distillation units exploited opportunities for heat recovery and removed inefficiencies such as the use of stripping steam instead of reboilers, the use of heat sources (for example, vacuum residue and pump-arounds), the cogeneration in the steam and power plant.

A. Posada and V. Manousiouthakis[14] studied the methane reforming based hydrogen production plant with the purpose of finding minimum utility cost (hot, cold and electricity). Keshavarzian et al., described the PA of the para-xylene separation unit of Borzouyeh Petrochemical Company[15]. Rossiter reported a detailed example of PA in crude distillation unit. After data acquisition, individuation of the energy target and the major inefficiencies, he individuated the main opportunities for retrofit desig: i) to rearrange existing heat exchangers to increase feed preheating and/or steam generation; ii) to add heat transfer area to existing matches between hot and cold streams; iii) to add new exchanger to introduce new matches between the streams8. His retrofit design reached the recovery of 45% of the energy target (14 MBtu/h in the crude preheating and 12.2 MBtu/h for steam generation at 120 psig) with a net saving of more than 2.5 M$ and a payback period of about 3 years. Shahani et al.[16] have suggested alternative design of hydrogen plants seen as a source of steam from waste heat recovery (apart from the primary purpose of producing hydrogen) because of the potentiality of the steam reforming to produce steam more efficiently than a conventional boiler. Further industrial case studies are reported on the IPIECA website[17].

For very large problems such as refining industries, mass and energy integration is necessary for reaching the best economic option. In similarity with the Heat exchange network, any synthesis process can be seen as the interconnection of different Mass Exchangers[18].Fig.3

This broader vision derives from the concept of seeing a process as a converter of energy (degradation) and matter (separation). This systemic approach is typical of chemical engineering and process engineering that see any complex system as an integration of unit processes. This representation has been intuitively depicted by T. Gundersen in 2013[19] at the International Process Integration Jubilee Conference.

Examples of water and hydrogen PA in the oil & gas sector can be found[20] for the Energy Recovery at a Fluid Catalytic Cracking (FCC) Unit[21]. Rajesh et al.[22] have presented an integrated approach to obtain possible sets of steady state operating conditions for improved performance of an existing plant, using an adaptation of a genetic algorithm that seeks simultaneous maximization of product hydrogen and export steam flow rates. The hydrogen PA in a petroleum refinery has been presented by M.K. Oduola and T.B. Oguntola that evaluated that  the  hydrogen margin between source and sink units has drastically reduced to about 17kNm3/h (~ 63% of reduction).[23] Nelson and Liu[24] created an automated pinch spreadsheet for the quick evaluation of hydrogen excess and the possible saving in the networks through the evaluation of sources and sinks by the Property Cascade Analysis (PCA) to establish the resource targets within a property integration framework. The fundamentals and the mathematical algorithms for wastewater minimization by PA can be found in the work of Wang and Smith[25].

Nevertheless, it is important to note that, if not bound properly and conducted by expert evaluators, the pinch analysis can lead to risky solutions or, simply, virtual solutions being not compatible with the system in which fall. The design must be therefore in depth examined by external expert auditors (in particular through the hazard analysis).


[1] Francesco G. Giacobbe 1986. Introduzione alla Pinch Technology. Le Pleiadi Editrice s.n.c.
[2] Nishida N., Stephanopoulos, G., Westerberg, A.W., 1981, A review of Process Synthesis, AichE J., 27.
[3] 1. Kemp, I.C., 2006. Pinch Analysis and Process Integration: A User Guide on Process Integration for the Efficient Use of Energy (Second Edition). Butterworth-Heinemann (Elsevier).
[4] AIChE Journal Vol 24, Issue 4, July 1978, Pages: 633–642, Bodo Linnhoff and John R. Flower “Synthesis of heat exchanger networks: I. Systematic generation of energy optimal networks”
[5] IChemE User Guide on Process Integration for the Efficient Use of Energy, 1st edition, in 1982
[6] Kemp, I.C. (2006). Pinch Analysis and Process Integration: A User Guide on Process Integration for the Efficient Use of Energy, 2nd edition. Includes spreadsheet software. Butterworth-Heinemann. ISBN 0-7506-8260-4.
[7] Pollution Prevention through Process Integration: Systematic Design Tools Di Mahmoud M. El-Halwagi. Pollution Prevention through process integration. Acedemic Press, San Diego 1997.
[8] A.P. Rossiter. Improve Energy Efficiency via Heat Integration 2010. Heat Transfer AichE. www.aiche.org/cep
[9] M.M. El-Halwagi and V. Manousiouthakis, Synthesis of mass exchange networks Aiche J. Volume 35, Issue 8 August 1989 Pages 1233–1244
[10] Martelli et al., 2012; Design criteria and optimization of heat recovery steam cycles for high efficiency, coal-fired, Fisher-Tropsch Plants. Proceedings of ASME Turbo Expo 2012; 2012, Copenhagen, Denmark
[11] John M. Joe, Ademola M. Rabiu. Retrofit of the Heat Recovery System of a Petroleum Refinery Using Pinch Analysis. Journal of Power and Energy Engineering, 2013, 1, 47-52.
[12] Yoon S-G., Lee, J., Park, S., Heat integration analysis for an industrial ethylbenzene plant using pinch analysis. Applied Thermal Engineering 2007; 27:886-93.
[13] Victor Briones, Ana L. Pérez, Luz M. Chávez, Rubén Mancilla, Marisol Garfias, Rodolfo Del Rosal, Nancy Ramírez Pinch analysis used in retrofit design of distillation units, 1999. http://www.ogj.com/articles/print/volume-97/issue-25/in-this-issue/refining/pinch-analysis-used-in-retrofit-design-of-distillation-units.html
[14] A. Posada and V. Manousiouthakis. Heat and Power Integration Opportunities in Methane Reforming based Hydrogen Production with PSA separation
[15] S. Keshavarzian, V. Verda, E. Colombo, P. Razmjoo. Fuel saving due to pinch analysis and heat recovery in a petrochemical company
[16] Shahani G.H, Garodz LJ, Murphy KJ, Baade WF, Sharma P. Hydrogen and utility supply optimization. Hydrocarbon Processing. 1998;77(9):143-148.
[17]Pinch Analysis IPIECA http://www.ipieca.org/energyefficiency/solutions/60431
[18] G.W. Garrison, B.L. Cooley, M.M. El Halwagi. Synthesis of Mass-Exchange Networks with Multiple Target Mass-Separating  Agents.
[19] T. Gundersen 2013. What is Process Integration? International Process Integration Jubilee Conference
[20] April M. Nelson and Y  A. Liu . Hydrogen-Pinch Analysis  Made  lasu An  automated  spreadsheet  method  can  quickly  help  minimize fresh  hydrogen  consumption  while  maximizing  hydrogen  recovery and  reuse in  petroleum  refineries  and  petrochemical  complex CHEI\4ICAL  ENGINEERING  WWW.CHE,COM  JUNE  2OO
[21] Natural Resourches Canada:  PINCH ANALYSIS: For the Efficient Use of Energy, Water & Hydrogen Her Majesty the Queen in Right of Canada, 2012
[22] Rajesh JK, Gupta SK, Rangaiah GP, Ray AK. Multi-objective optimization of steam reformer performance using genetic algorithm. Industrial and Engineering Chemistry Research 2000;39:706-717.
Rajesh JK, Gupta SK, Rangaiah GP, Ray AK. Multi-objective optimization of industrial hydrogen plants. Chemical Engineering Science 2001;56:999-1010.
[23] M. K. Oduola T. B. Oguntola Hydrogen pinch analysis of a petroleum refinery as an energy management strategy
[24] Nelson Liu Virginia Poytech Institute
[25] Y.P. Wang, R. Smith, 1994. Wastewater Minimization. Chemical  Engineering  Science  49 pp.  981-1006.


Bioremediation of Hydrocarbon Contaminated Soil Using Selected Organic Wastes

 Author: Vincenzo Piemonte, Associate Professor, University UCBM – Rome (Italy)


1.Theme description

The large increase in the past century of industrial development, population growth and urbanization favoured the release of hazardous chemicals in the environment and a general global pollution. Several chemicals, including heavy metals and radionuclides, but also organic compounds such as pesticides, dyes, Polycyclic Aromatic Hydrocarbons (PAHs), may persistently accumulate in soils and sediments, thus potentially menacing human health and environment quality, due to their carcinogenic and mutagenic effects, and ability to bioconcentrate throughout the trophic chain[1].

The concern on toxicity risk and environmental pollution associated with chemical contaminants has called for the development and application of remediation techniques. In fact, a large effort has been devoted to find ways to remove contaminants from ecosystems. In particular, several strategies were devised to remediate and restored polluted soils, based on physical, chemical and biological methods. These techniques may be applied in situ, i.e. in the very contaminated soil, thus offering numerous advantages over ex situ technologies, whereby the soil is removed to be treated elsewhere. Thus, in situ remediation techniques do not require soil transportation costs and can be applied to diluted and widely diffused contaminations, thus minimizing dangerous intensive environmental manipulation. Conversely, ex situ processes imply the excavation of polluted soil and their decontamination to be conducted in a separate processing plant[2]. Table 1 summarizes the main technologies for cleaning up polluted soils and the estimated costs for each treatment.

Depending on contaminants characteristics and soil properties, different soil remediation technologies can be applied with variable success. However, effective eco-friendly biological, physical and chemical remediation practices are being today preferred over the techniques which imply larger biotic and abiotic environmental impacts.

Table 1. Main technologies for cleaning up of polluted soils and the estimated costs of each treatment.
Treatment Approximate remediation cost (£/tonne)
Removal to landfill Up to 100
Solidification
Cement and Pozzolan based 25-175
Lime based 25-50
Vitrification 50-525
Physical processes
Soil washing 25-150
Physico-chemical washing 50-175
Vapour extraction 75
Chemical Processes
Solvent extraction 50-600
Chemical dehalogenation 175-450
In situ flushing 25-80
Surface amendments 10-25
Thermal treatment
Thermal desorption 25-225
Incineration 50-1200
Biological treatment  
Windrow turning 10-50
Land farming 10-90
Bioventing 15-75
Bioslurry 50-85
Biopiles 15-35
In situ bioremediation 175


2.Bioremediation Methods

Bioremediation, either as a spontaneous or as a managed strategy, involves the application of biological agents to clean-up environmental compartments polluted by hazardous chemicals. Plants, microorganisms and plant-microorganism associations, either naturally occurring or tailor-made for the specific purpose, represent the main bioremediation active factors.

fig.02

Figure 1- Bioremediation scheme.

2.1 Microorganisms

In contaminated soils, aromatic Anthropogenic Organic Pollutants (AOPs) can be degraded by bacteria or fungi via an aerobic or anaerobic metabolism or both. In aerobic metabolism, molecular oxygen is incorporated into the aromatic ring prior to dehydrogenation and subsequent aromatic ring cleavage. In anaerobic metabolic processes molecular oxygen is absent, and alternative electron acceptors, such as nitrate, ferrous iron, and sulfate, are necessary to oxidize aromatic compounds.

The effective agents in the transformation of organic pollutants are the microbial enzymatic system that, as powerful catalysts, extensively modify the structure and toxicological properties of contaminants or completely mineralize the organic molecule into innocuous inorganic end products. However, in order to be biodegraded, contaminants must interact with the enzymatic system within the biodegrading organisms. If soluble, they can easily enter cells, but, if insoluble, they must be transformed into soluble or more easily cell-available products.

Their main sources of these enzymes are fungi, such as wood-degrading basidiomycetes, terricolous basidiomycetes, ectomycorrizal fungi, soil-borne microfungi, and actinomycetes. Most fungi are robust organisms and may tolerate larger concentrations of pollutants than bacteria. In particular, white-rot fungi appear unique and attractive organisms for the bioremediation of polluted sites. A possible alternative to the bioremediation of polluted sites by microbial activity may be the direct application of cell-free enzymes after their isolation from microbial cultures.

Bioremediation of contaminants can be more rapidly accomplished by two methods, bioaugmentation and/or biostimulation[3]. The process of bioaugmentation, as it applies to remediation of petroleum hydrocarbon contaminated soils, involves the introduction in a contaminated system of microorganisms that have been exogenously cultured with the aim to degrade specific chains of hydrocarbons. These microbial cultures may be derived from the very same contaminated soil or obtained from a stock of microbes that have been previously proven to degrade hydrocarbons. On the other hand, the biostimulation process implies the addition to polluted soils of nutrients in the form of organic and/or inorganic fertilizers, in order to stimulate the activity and proliferation of indigenous microbes. These may or may not be proved to aim the polluting hydrocarbons as a primary food source. However, the hydrocarbons are assumed to be degraded more rapidly in comparison to natural attenuation processes, probably because of the increased number of microorganisms induced by the greater amount of nutrients provided to the contaminated soil.

2.2 Plants

Phytoremediation of organic and inorganic contaminants involves either a physical removal of pollutants or their bioconversion (biodegradation or biotransformation) into biologically inactive forms. The conversion of metals into inactive forms can be enhanced by external conditioning of soils: enhancement of soil pH (e.g. through liming), addition of organic matter (e.g. sewage sludge, compost etc.), inorganic anions (e.g. phosphates) and metal oxides and hydroxides (e.g. iron oxides). Concomitantly, plants can play a role here in transforming contaminants in inactive forms by releasing different anionic species in soil and altering soil redox conditions[4].

The uptake of AOPs by plants occurs through two pathways. One pathway is the soil-water-plant cycle in which pollutants are uptaken from the soil solution and then transported up plant shoots within the xylem transpiration system. A second pathway involves the soil-air-plant cycle, in which AOPs are uptaken by aerial parts of plants either from soil particles adsorbed on plant leaves or directly as gaseous forms of AOPs after their volatilization from soil. Following plant uptake, AOPs are further translocated, sequestered, and degraded in plant tissues by other processes. The key parameters which influence the translocation of contaminants from soil to plant include the content of contaminants in soil (or water), their physical-chemical properties, the plant species, the soil types, and the time of exposure to plant[5].

The advantages of phytoremediation over other approaches is due to the inherent preservation of soil natural structure and to the free sunlight energy involved in the process, that enhances the content of degrading microbial biomass in soil.

2.3 Compost and Biochar

The composting process is the biological decomposition of organic wastes under controlled aerobic conditions. In contrast to uncontrolled natural decomposition of organic compounds, the temperature in composting waste heaps can increase by self heating to the ranges which are typical of mesophilic (25-40 °C) and termophilic microorganisms (50-70 °C). The end product of composting is a biologically stable humus-like product that can be employed in several applications, e.g.: soil conditioner, fertilizer, biofiltering material, fuel. The composting process can concomitantly reach different objectives, such as the volume and mass reduction of biomasses, their stabilization and drying, and the elimination of phytotoxic substances and pathogens[6].

Composting is also a method to be employed in the decontamination of polluted soils, because compost is capable of sustaining various microbial populations potentially hydrocarbons’ degraders, such as bacteria, including bacilli, pseudomonas, mesophilic and thermophilic actinomycetes, and lignin-degrading fungi. Compost can also improve the chemical and physical properties of soil to be decontaminated, since it affects soil pH, nutrients and moisture content, soil structure, and microbial biomass population.

Unless coupled with more bioactive compost materials, the possible use of biochar in the remediation of contaminated soil appears limited by its inherent biological recalcitrance that depresses the activity of pollutants microbial degraders[7].

3.Case Study: Bioremediation by selected organic wastes

Inadequate mineral nutrient, especially nitrogen, and phosphorus, often limits the growth of hydrocarbon utilizing bacteria in water and soil. Addition of nitrogen and phosphorus to an oil polluted soil has been shown to accelerate the biodegradation of the petroleum in soil. It was reported that 18.7% and 31.2% higher crude oil biodegradation in soil amended with chicken droppings and fertilizer, respectively, compared to un-amended control soil after 10 weeks while degradation of crude oil in soil amended with melon shells as source of nutrients was 30% higher than those of un-amended polluted soil after 28 days[8].

Addition of a carbon source as a nutrient in contaminated soil is known to enhance the rate of pollutant degradation by stimulating the growth of microorganisms responsible for biodegradation of the pollutant.

It has been suggested that the addition of carbon in the form of pyruvate stimulates the microbial growth and enhances the rate of Polyciclic Aromatic Hydrocarbons (PAHs) degradation. Mushroom compost and spent mushroom compost (SMC) are also applied in treating organo-pollutant contaminated sites. Addition of SMC results in enhanced PAH-degrading efficiency (82%) as compared to the removal by sorption on immobilized SMC (46%). It is observed that the addition of SMC to the contaminated medium reduced the toxicity, added enzymes, microorganisms, and nutrients for the microorganisms involved in degradation of PAHs[9].

Therefore, utilization of organic waste in the bioremediation of soil seems a highly potential area. This will reduce the amount of organic waste sent to landfill, thus reduce the emission of landfill gases and also provide a cheap source of organic additive for the remediation purpose.

 FIG3

Figure 2 – Percentage biodegradation of petroleum hydrocarbon in soil contaminated with used lubricating oil and amended with organic wastes.
 

Figure 3 shows the biodegradation of a lubricating oil in soil (throughout the period of 98 days) are reported in Agamuthu et al. 2013[10]. The results showed high biodegradation of used lubricating oil at the end of 98 days with soil amended with organic wastes compared to the control soil treatment. At the end of 98 days, used lubricating oil contaminated soil amended with cow dung showed the highest percentage of oil biodegradation with 94%, followed by soil amended with sewage sludge which is 82% compared to the un-amended control soil that showed 66% of biodegradation of oil at the end of 98 days. Used lubricating oil contaminated soil amended with organic wastes have greater oil biodegradability compared to un-amended control soil in this study.

The main difference of oil biodegradation between the soil amended with organic wastes and unamended soil treatment occurred during the 14-28 days, where biostimulation resulted in significant increase of oil biodegradation. The addition of nutrients stimulates the degradative capabilities of the indigenous microorganisms thus allowing the microorganisms to break down the organic pollutants at a faster rate.

In conclusion, bioremediation can be a viable and effective response to soil contamination with petroleum hydrocarbons and can be positively enhanced by the use of organic wastes.


[1] K.T. Semple, B.J. Reid, T.R. Fermor, Impact of composting strategies on the treatments of soils contaminated with organic pollutants, Environ. Pollut., 112 269-283 (2001).
[2] T. Iwamoto and M. Nasu, Current bioremediation practice and perspective, J. Biosci. Bioeng. 92, 1-8 (2001).
[3] C.J. Cunningham and J.C. Philp, Comparison of bioaugmentation and biostimulation in ex situ treatment of diesel contaminated soil, Land Contamination & Reclamation, 8, 261-269 (2000).
[4] J. Peng, Y. Song, P. Yuan, X. Cui, G. Qiu, The remediation of heavy metals contaminated sediment, J. Hazard. Mater., 161, 633-640 (2009).
[5] C.T. Chiou, Partition and adsorption of organic contaminants in environmental systems, John Wiley & Sons, New York (2002).
[6] E. Mena, A. Garrido, T. Hernández, C. García, Bioremediation of sewage sludge by composting, Commun. Soil Sci. Plan., 34, 957-971 (2003).
[7] L. Beesley, E. Moreno-Jiménez, J.L. Gomez-Eyles, E. Harris, B. Robinson, T. Sizmur, A review of biochars’ potential role in the remediation, revegetation and restoration of contaminated soils, Environ. Pollut., 159, 3269-3282 (2011).
[8] Abioye OP, Abdul Aziz A, Agamuthu P. Stimulated biodegradation of used lubricating oil in soil using organic wastes. Malaysian Journal of Science, 2009; 28(2):127-133.
[9] Lau KL, Tsang YY, Chiu SW. Use of spent mushroom compost to bioremediate PAH-contaminated samples. Chemosphere, 2003; 52(9): 1539–1546.
[10] P. Agamuthu, Y.S. Tan, S.H. Fauziah, Bioremediation of hydrocarbon contaminated soil using selected organic wastes, Procedia Environmental Sciences 18 ( 2013 ) 694 – 702


Life Cycle Assessment (LCA)

Author: Vincenzo Piemonte, Associate Professor, University UCBM – Rome (Italy)


1.Theme description

The Life Cycle Assessment (LCA) allows to evaluate the interactions that a product or service has with the environment, considering its whole life cycle that includes the preproduction points (extraction and production of raw materials), production, distribution, use (including reuse and maintenance), recycling, and final disposal. So the objectives of the LCA are to evaluate the effects of the interactions between a product and the environment, and therefore the environmental impacts directly or indirectly caused by the use of a given product.

fig 1

Figure 1 -Example of a product System for LCA

LCA can be conducted by assessing the environmental footprint of a product from raw materials to production (Cradle to gate), or to be extended to the whole product life cycle, including its disposal (Cradle to grave ).  If the analysis is performed directly on the categories of environmental impact, such methodology is called “Mid-point approach“. A viable and valid alternative is represented by the “End-point approach “ or ” Damage-oriented approach

fig 2

Figure 2 – LCA structure


According to ISO 14040[1] and 14044[2], the LCA is achieved through four distinct phases:

  • Goal and Scope.
  • Life Cycle Inventory (LCI).
  • Life Cycle Impact Assessment (LCIA)
  • Interpretation (normalization and weighting)


2.LCA Phases

In the first phase, the goal and scope of study are formulated and specified in relation to the intended application. The object of study is described in terms of a socalled functional unit. Apart from describing the functional unit, the goal and scope should address the overall approach used to establish the system boundaries. The system boundary determines which unit processes are included in the LCA and must reflect the goal of the study.

The second phase ‘‘Inventory’’ involves data collection and modeling of the product system as well as description and verification of data. This phase encompasses all data related to environmental (e.g., CO2) and technical (e.g., intermediate chemicals) quantities for all relevant unit processes within the study boundaries that compose the product system. The data must be related to the functional unit defined in the goal and scope phase. The results of the inventory are a life cycle inventory (LCI), which provides information about all inputs and outputs in the form of elementary fluxes between the environment and all the unit processes involved in the study.

The third phase ‘‘Life Cycle Impact Assessment (LCIA)’’ is aimed to evaluate the contribution to impact categories such as global warming and acidification. The first step is termed characterization. Here, impact potentials are calculated based on the LCI results. The next steps are normalization and weighting, but these are both voluntary according the ISO standard. Normalization provides a basis for comparing different types of environmental impact categories (all impacts get the same unit). Weighting implies assigning a weighting factor to each impact category depending on the relative importance.

Issues such as choice, modelling and evaluation of impact categories can introduce subjectivity into the LCIA phase. Therefore, transparency is critical to the impact assessment to ensure that assumptions are clearly described and reported.

fig 3

Figure 3 – Stages of an LCA


The LCIA addresses only the environmental issues that are specified in the goal and scope. Therefore, LCIA is not a complete assessment of all environmental issues of the product system under study. LCIA cannot always demonstrate significant differences between impact categories and the related indicator results of alternative product systems. This may be due to

  • limited development of the characterization models, sensitivity analysis and uncertainty analysis for the LCIA phase,
  • limitations of the LCI phase, such as setting the system boundary, that do not encompass all possible unit processes for a product system or do not include all inputs and outputs of every unit process, since there are cut-offs and data gaps,
  • limitations of the LCI phase, such as inadequate LCI data quality which may, for instance, be caused by uncertainties or differences in allocation and aggregation procedures, and
  • limitations in the collection of inventory data appropriate and representative for each impact category.

The last phase, named ‘‘interpretation,’’ is an analysis of the major contributions, sensitivity analysis, and uncertainty analysis. This stage leads to the conclusion whether the ambitions from the goal and scope can be met.

The interpretation should reflect the fact that the LCIA results are based on a relative approach, that they indicate potential environmental effects, and that they do not predict actual impacts on category endpoints, the exceeding of thresholds or safety margins or risks. The findings of this interpretation may take the form of conclusions and recommendations to decision-makers, consistent with the goal and scope of the study.

Life cycle interpretation is also intended to provide a readily understandable, complete and consistent presentation of the results of an LCA, in accordance with the goal and scope definition of the study.

The interpretation phase may involve the iterative process of reviewing and revising the scope of the LCA, as well as the nature and quality of the data collected in a way which is consistent with the defined goal.

The findings of the life cycle interpretation should reflect the results of the evaluation element.


3.LCA Methods and Softwares

The LCA analysis can be performed by using softwares (the most important and used are SimaPro[3], Boustead[4], Gabi[5]) which implements several LCA methodologies. Among these, the most used methods at mid point level are:

  • CML 2001[6] that computes 10 impact categories (Abiotic Depletion, Acidification, Eutrophication Climate change – GWP100, Ozone Layer Depletion, Human Toxicity, Freshwater Ecotoxicity, Marine Ecotoxicity, Terrestrial Ecotoxicity, Photochemical Oxidation);
  • Cumulative Energy Demand (CED)[7], generally used for the evaluation of the primary energy savings, which accounts for 6 impact categories (Non renewable, fossil; Non renewable, nuclear; Renewable, biomass; Renewable, wind, solar, geothermal; Renewable, water)
  • Intergovernmental Panel on Climate Change (IPCC)[8] is used for the assessment of the Global Warming and is a typical single issue methodology.

As for the methods at end-point level (or damage level), one of the most interesting is the Eco-indicator 99[9]. This approach deals with 11 mid-point impact categories (Carcinogenesis, Respiratory Organics, Respiratoty Inorganics, Climate Change, Radiation, Ozone Layer, Ecotoxicity, Acidification/Eutrophication, Land Use, Minerals, Fossil Fuels) further aggregated into representative macro-categories of overall damage: Human Health, Ecosystem Quality and Resources. The impact categories from carcinogens to ozone layer are then normalized and grouped in the macrocategory (end-point level or damage level) ‘‘Human Health’’ that takes in to account the overall impact (damage) of the emissions associated to the product analyzed on the human health. The categories ecotoxicity, acidification/eutrophication, and land use are included in the macrocategory ‘‘Ecosystem Quality’’ that accounts for the overall damage on the environment, while the ‘‘minerals and fossil fuels’’ are grouped in the macrocategory ‘‘Resources’’ that accounts for the depletion of non renewable resources. The impact category indicator results that are calculated in the characterization step are directly added to form damage categories. Addition without weighting is justified, because all impact categories that refer to the same damage type (like damage to the Ecosystem Quality) have the same unit (for instance, PDF*m2yr; PDF, potentially disappeared fraction of plant species). This procedure can also be interpreted as grouping. The damage categories (and not the impact categories) are then normalized on an European level (damage caused by 1 European per year), mostly based on 1993 as base year, with some updates for the most important emissions.


4.Case Study: Produced Water Treatment

Due to its complex and polluting composition, norms regarding the discharge of produced water into the environment have gradually become more and more limiting and strict. The costs of appropriate produced water treatments amount to about 40 billion dollars per year and they weigh clearly on the price of final products. For this reason, it is necessary that the water can be reused after being treated, this is especially true in arid places where water is a valuable and precious asset. The aim of this case study is to highlight the importance of treating the produced water, and understand their environmental importance. The assessment includes the entire life cycle of the process: the extraction and processing of raw materials, manufacturing, transportation, distribution, use, reuse, recycling and disposal.

the LCA method is applied to the most important produced water treatments, by using as process simulator Gabi 6. The analysis and the comparison have been made in for the two cases:

  1. Reinjection + Primary treatments (see figure 4);
  2. Reinjection + All treatments (including secondary and tertiary treatments) (see figure 5);

 fig 4

Figure 4 – Reinjection + Primary Treatments


fig 5

Figure 5 -Reinjection + All Treatments

  fig 6

Figure 6 – LCA resut Comparison

Primary treatments accounts mainly of physical treatments aimed to the removal of suspended oil, while secondary treatments are focused on the removal f dissolved organic compoundes (mainly BTEX). The application of tertiary treatments (membranes) is necessary to make the produced water suitable not only for the disposal but to be used in civil and industrial fields. In this way it can represents a resource with economic value, rather than an oil extraction waste.

Figure 6 reports the LCA results comparison for the two systems under analysis in terms of three important impact categories of mid point level, which accounts for the global waming, the ecotoxicity and human health. As it can be see from the figure the presence of secondary and tertiary treatments strongly reduces the impact on ecotoxicity and human health, while the global warming effect is higher than that of system 1 (only primary systems) mainly due to incidence of GHG gases produced during the secondary and tertiary treatment processes.


[1] ISO 14040:2006, Environmental management—Life cycle assessment—Principles and framework.
[2] ISO 14040:2006, Environmental management—Life cycle assessment—Requirements and guidelines.
[3] https://simapro.com/products/advanced-simapro-training/
[4] http://www.bousteadusa.com/bousteadLCA.html
[5] http://www.gabi-software.com/italy/solutions/life-cycle-assessment/?gclid=CKOOkeuVossCFUHGGwodwrAJjw
[6] http://www.earthshift.com/software/simapro/clm2001
[7] http://www.earthshift.com/software/simapro/ced
[8] https://www.ipcc.ch/publications_and_data/publications_and_data_reports.shtml
[9] http://www.earthshift.com/software/simapro/eco99


LNG R&D for the Liquefaction and Regasification Processes

 Author: Marcello De Falco, Associate Professor, University UCBM – Rome (Italy)


1.Theme description

Liquefied Natural Gas (LNG) is used for transporting natural gas (NG) to distant markets, not supplied by NG grid connecting the extraction/production point to the users.

Basically the LNG process is composed by the following steps[1]:

  • Extracted natural gas is liquefied in the production field or in a close site, after removing the impurities. Usually, in the liquefaction process the gas is cooled to a temperature of approximately -162°C at ambient pressure.
  • Then, the LNG is loaded onto double-hulled ships which are used for both safety and insulating purposes and transported to the receiving harbor.
  • As arrived, the LNG is loaded into well-insulated tanks and, then, re-gasified in specific plants.
  • At the end, the re-gasified NG is fed to the pipeline distribution system and delivered to the end-users.

But, the high production, transportation and storage costs have reduced the LNG technology spread to specific cases in which there are not other cheaper ways to transport the NG.

But, the market and political issues related to the NG are increasing the interest on this alternative transportation technology, which has the benefits of enlarging the potential markets for sellers and the potential suppliers for the buyers (refer to Figure 1). The growing interest has led to greater and greater investments on LNG Research & Development and on its applications.


global LNG

Fig. 1 – Global LNG demand[2]

In the following, some of the technologies and innovations related to the LNG production, the transportation and the regasification fields are reported and assessed.

2.NG Liquefaction processes

A liquefied natural gas plant (LNG plant) is usually divided into four steps[3]:

  1. pretreatments;
  2. acid gas removal;
  3. dehydration;
  4. liquefaction

The pretreatment unit, where the undesired substances are removed, is the same used in the conventional production/distribution process and is composed by separations units and a slug catcher able to separate the gas from oil and water phases.

Then, the NG is purified from acid gases as hydrogen sulfide (H2S) and carbon dioxide (CO2) by means of absorption/adsorption processes. Also in this step, conventional technologies are used.

In the step 3, an adsorbent is used to remove water from the natural gas from which impure substances have been removed. By this way, ice will not form during the subsequent step.

Then, the NG is ready to be liquefied in the core unit of the process, the liquefaction unit, in which the NG is cooled down and liquefied at –160°C or less. Because of the extremely low operating temperatures need, the liquefaction process requires a enormous amount of energy, usually supplied burning a share of the NG feedstock. The R&D efforts are focused mainly of this step, proposing innovations able to reduce the energy consumption and improve the liquefaction process efficiency.

The main liquefaction processes and innovations are:

  • C3-MR method, which is the most applied. After the acid gas separation, the NG is dried and pre-cooled to -35°C using propane. Then, it passes through the tubes of a tubes-and-shell heat exchanger, fed a refrigerant to the shell zone. The final temperature of the NG is between -150°C and -162°C. A process scheme is shown in Figure 2.

C3-MR Process

Fig. 2 – C3-MR process scheme [4]
  • AP-X method, which is an evolution of C3-MR process to be applied for large liquefaction plants. The process is based on the integration of LNG sub-coolers with nitrogen coolant used according to the C3-MR method, without increasing the size of the main heat exchanger[5].
  • Cascade method, which sequentially uses propane, ethylene and methane as coolants in a cascade configuration (Phillips Petroleum Company[6]).
  • DMR (Double mixed refrigerant) method, which uses two kinds of mixed coolants (an ethane and propane mix and a nitrogen-methane, ethane and propane mix) and applied by Shell. The process is able to reduce the operating cost of 6-8%, compared to the C3-MR configuration[7].


Since all these configurations require large amounts of energy (mainly for the refrigeration compressors), growing R&D efforts are devoted to the process optimization. The main R&D activities are focused on the cryogenic heat exchanger design and optimization (Air Product and Chemicals Inc. technology[8]), on the improvement of refrigerant compressors (SplitMR technology) and on the efficiency of the compressors’ drivers.

3.LNG transportation technologies

The LNG transportation process can be summarized as follow:

  • Firstly, the insulated tanks placed on the LNG ship have to be inerted to avoid the explosion risk;
  • Then, the tanks are cooled-down to be ready to be charged by cryogenic LNG. The cooling-down process is made spraying into the tanks the LNG, which vaporizes cooling down the environment inside the tank.
  • After tanks cooling, the LNG is pumped from the on-site storage tanks into the vessel tanks.

Basically, two vessel technologies are applied:

  1. The Floating Storage Unit (FSU), able only to transport the LNG and pump it to the on-shore storage tanks in the receiving port (Figure 3[9])
  2. The Floating Storage and Regasification Unit (FSRU), in which the regasification plant is assembled and the regasified NG is then fed directly to the grid (Figure 4[10]).

FSU Vessel

Fig. 3 – FSU vessel for LNG transportation

FSRU VESSEL

Fig. 4 – FSRU vessel for LNG transportation and regasification

The R&D on the sector is mainly focused on the improvement of FSRU performance and reduction of costs, being the FSRU an attractive fast track solution for small markets and emerging economies.

4.Regasification technologies

The regasification facilities are able to boil the LNG and to sent it into the NG grid. Almost 100 LNG regasification terminals are now operating worldwide and many others are under-construction, mainly in Europe and Asia.

The most applied regasification technologies are:

  • Open Rack Vaporizer (ORV) – An ORV is a vaporizer in which LNG flows inside a tube and is heated up by seawater, which is fed through the shell (refer to Figure 5). The LNG flows in from an inlet nozzle near the bottom, passes through an inlet manifold and is recovered in an outlet manifold placed in the upper zone. To avoid the ice formation in the lower part of the heat transfer tubes, innovative tube structures are proposed, as the Kobe Steel (SuperORV) one composed a duplex-pipe structure to suppress icing on the outer surface, thus significantly improving the vaporizing performance.
Open Rack
Fig. 5 – Open Rack Vaporizer layout[11].
  • Fluid-type Vaporizer (FV) – a FV is a vaporizer in which the seawater (the heat source) vaporizes the LNG via a heating medium as the propane. The technology was developed by Osaka Gas and is called TRI-EX. The configuration of a FV combines three tubes-and-shell heat exchangers: an intermediate fluid vaporizer, a LNG vaporizer and NG trim heater (Figure 6).

Open Rack

Fig. 6 – Fluid-type Vaporizer schematic layout[12].
  • Submerged combustion vaporizers (SCV) – An SCV has a structure in which a submerged burner burns a fuel-gas, generating the heat needed to vaporize the LNG flow. It comprises a tank, the burner, a bundle of heat-transfer tubes, combustion-air fan and fuel-supply control device.

submerged

Fig. 7 – Submerged combustion vaporizers configuration[13].


[1] http://energy.gov/fe/science-innovation/oil-gas/liquefied-natural-gas
[2] http://www.ey.com/GL/en/Industries/Oil—Gas/Global-LNG–New-pricing-ahead—LNG-demand-growth
[3] https://www.chiyoda-corp.com/technology/en/lng/liquefaction.html
[4] http://www.ivt.ntnu.no/ept/fag/tep4215/innhold/LNG%20Conferences/2007/fscommand/PS2_5_Pillarella_s.pdf
[5] http://www.airproducts.com/~/media/files/pdf/industries/lng-large-capacity-single-train-ap-xtm-hybrid-lng-process.pdf
[6] http://www.arcticgas.gov/sites/default/files/documents/history-kenai-lng.pdf
[7] http://www.ogj.com/articles/print/volume-100/issue-27/processing/double-mixed-refrigerant-lng-process-provides-viable-alternative-for-tropical-conditions.html
[8] J. Bukowksi et al., “Innovations in Natural Gas liquefaction technology for Future LNG plants and floating LNG facilities”, International Gas Union Research Conference 2011.
[9] http://www.gasolplc.com/our-business/malta-lng-to-power-project.aspx
[10] http://excelerateenergy.com/fsru-projects/
[11] R. Agarwal, “LNG Regasification – Technology evaluation and cold Energy utilization”, Queensland University of Technology, Australia.
[12] http://www.kobelco.co.jp/english/ktr/pdf/ktr_32/064-069.pdf
[13] http://www.wetenschapsforum.nl/index.php/topic/143155-rendementsberekening-van-lng-verdamper/


EKRT – Electro-Kinetic Remediation Technology for Soil Contaminated by Heavy Metals

Author: Marcello De Falco, Associate Professor, University UCBM – Rome (Italy)


1.Theme description

The effects on the human health and the impact on the environment due to the exposure to and the presence of heavy metals as lead, cadmium, mercury and arsenic have been extensively studied by international bodies as WHO, attesting clearly a significant negative impact also at low metals composition. Although adverse health effects have been known for a long time, the exposure to heavy metals continuously increases due to their extensive use in industry [1] (refer to Figure 1).

fig.1

Fig. 1 – Global production and consumption of heavy metals during the period 1850–1990 [2]


Specifically, the soil contamination by heavy metals is particularly dangerous for humans and for the ecosystems since most metals do not undergo microbial or chemical degradation and their concentration in soils persists for a long time and it is accumulated. The main risks associated are listed as follow [3]:

  • direct ingestion or contact with contaminated soil;
  • food chain (soil-plant-human or soil-plant-animal-human);
  • drinking of contaminated ground water;
  • reduction in food quality (safety and marketability) via phytotoxicity;
  • reduction in land usability for agricultural production causing food insecurity.

The soil contamination is an increasing issue for the expansion of industrial areas, disposal of high metal wastes, leaded gasoline and paints, land application of fertilizers, sewage sludge, pesticides, wastewater irrigation, coal combustion residues, spillage of petrochemicals [4].

Some technologies have been developed worldwide for the remediation of contaminated soil. The most widely applied are:

  • Immobilization – organic and inorganic amendments are applied to alter the original soil metals to more geochemically stable phases via sorption, precipitation and complexation processes [5]. Among the immobilization technologies, the most used are Solidification/Stabilization and Vitrification.
  • Soil Washing – it is essentially a volume reduction/waste minimization treatment process. There are two soil washing techniques: physical separation, by which the soil particles which host the majority of the contamination are physically separated from the bulk soil fractions; chemical extraction, by which contaminants are removed from the soil by aqueous chemicals and recovered from solution on a solid substrate [6].
  • Photoremediation – it uses vegetation and associated microbiota and agronomic techniques to remove or contain contaminants harmless [7]. The most used technique is the Phytoextraction, i.e. the process where plant roots uptake metal contaminants from the soil to their above soil tissues.

But, the most interesting technology in terms of cost, efficiency and easiness in management is the Electro-Kinetics Remediation (EKRT): an electric field is generated by two electrodes inserted into the ground and encapsulated in extraction wells and the electrically charged metal ions are transported, collected and removed from the soil (a conceptual scheme is reported in Figure 2 [8]).

Electro-Kinetics Remediation technology is known and applied since 20 years, but ENI, with the partnership of the University of Ferrara, has developed an optimized EKRT configuration for heavy metal recovery from contaminated soil, better described in the following paragraph.

fig.2

Fig. 2 – EKRT functioning scheme


2. ENI’s Electro-Kinetic Remediation Technology

ENI developed an optimized EKRT able to reduce the technology costs and to improve the application easiness, mainly for large-scale use. ENI’s EKRT can be applied to remove from the contaminated soil a wide variety of metals, as Zn, Pb, As, Cd, Co, Fe, Cr, Mn, Cu, Sn.

The main innovations introduced concern:

  • the reduction of the electrodes number, allowing a management simplification and a saving of 30% approx. on the final cost.
  • Commercial electrodes are installed, fabricated with a new production method able to reduce their costs (50% lower than electrodes used a decade ago).
  • Optimization of the electrolytic solution. The solution used by the conventional technology is aggressive and provokes a soil contamination, while the simplified electrolytic solution developed and optimized is able to mobilize the metals without a further pollution of the ground.
  • Easiness of the management and control system. Thanks to the optimized electrodes configuration and to the simplified electrolytic solution, the operative control system is much easier and more robust than the conventional ones.
  • The better performance of the ENI’s architecture allows a reduction of the voltages applied for the electric field generation and of the remediation time, leading to an energy saving and a reduction of operative costs.

fig.3

Fig. 3 – EKRT configuration developed by ENI and University of Ferrara [9].


The major benefits can be summarized as follow:

  • In-situ treatment;
  • High efficiency in terms of pollutant removal;
  • It does not require heavy interventions of soil handling (with the exception of the electrode installation), no excavations and/or transportation of polluted material;
  • High level of environmental sustainability and social acceptability;
  • Improved performance than similar solutions on the market;
  • Lower investment costs and lower operating costs (savings up to 50%);
  • Simple management;
  • All the installed equipment can be re-used;
  • wide range of applicability since the technology can be used to remove various metals as Zn, Pb, As, Cd, Co, Fe, Cr, Mn, Cu, Sn by simply varying applied voltage, application time and electrolytic solution.


3.Application and state-of-the-art

ENI has performed EKRT experimental tests on site using real soils. Both the single metal (Hg) and a more complex (many metals) decontamination applications have been assessed, with very promising results in terms of recovery efficiency and operative easiness.

In the following some images, taken from the ENI website, show the electrodes installation and the experimental phases.

fig.4

Fig. 4 – EKRT electrode installed on-site

fig.5

Fig. 5 – Electrodes distancing

fig.6

Fig. 6 – Experimental tests


ENI patented the EKRT solution (patent application n° MI2012A001889), and the patent approval is in progress.


[1] http://bmb.oxfordjournals.org/content/68/1/167.full
[2] Nriagu JO. History of global metal pollution. Science 1996; 272: 223–4
[3] http://www.hindawi.com/journals/isrn/2011/402647/
[4] S. Khan, Q. Cao, Y. M. Zheng, Y. Z. Huang, and Y. G. Zhu, “Health  risks of heavy metals in contaminated soils and food crops irrigated with wastewater in Beijing, China,” Environmental Pollution, vol. 152, no. 3, pp. 686–692, 2008.
[5] Y. Hashimoto, H. Matsufuru, M. Takaoka, H. Tanida, and T. Sato, “Impacts of chemical amendment and plant growth on lead speciation and enzyme activities in a shooting range soil: an X-ray absorption fine structure investigation,” Journal of Environmental Quality, vol. 38, no. 4, pp. 1420–1428, 2009.
[6] G. Dermont, M. Bergeron, G. Mercier, and M. Richer-Laflèche, “Soil washing for metal removal: a review of physical/chemical technologies and field applications,” Journal of Hazardous Materials, vol. 152, no. 1, pp. 1–31, 2008.
[7] S. D. Cunningham and D. W. Ow, “Promises and prospects of phytoremediation,” Plant Physiology, vol. 110, no. 3, pp. 715–719, 1996.
[8] http://www.eni.com/en_IT/innovation-technology/technological-focus/bonifiche-ekrt/bonifiche-ekrt.shtml
[9] http://www.eni.com/en_IT/innovation-technology/technological-focus/bonifiche-ekrt/bonifiche-ekrt.shtml