Research Highlights in New Catalytic Technologies

Author: Mauro Capocelli – Researcher –University UCBM – Rome (Italy)


1.Theme Description

Catalysts are compounds use for increasing the velocity of a specific reaction by reducing the activation energy.[1] This brings down temperature/pressure of the processes saving fuel. Catalysts can be homogenous or heterogenous depending on the phase involved in the reactions (i.e. heterogenous catalysts usually are solid while the reagents are liquid or gaseous).[2] These substances are not reduced by the reactions, but over time catalytic activity and selectivity decrease due to phenomena such as poisoning, fouling coking, carbon deposition and sintering.[3] Therefore regeneration is necessary. In 2014 the global market for catalysts and catalysts regeneration reached 24.6 Billion of US$[4]and it is estimated to achieve 34.3 Billion of US$ in 2024.[5]

fig.01

Figure 1– Common catalysts use in refining and petrochemical processes[6]


Nowadays the main companies are: Haldor Topsoe, UOP, Johnson Matthey, Süd-Chemie, BASF, Exxon Mobil Chemical and so on.[7] In the following sections catalyst technologies in chemical and refining sectors are described. In addition, new trends in the development of catalysts are illustrated.


2.Catalysts in Industrial Processes

Catalysts are widespread into Industrial Processes, from chemical to refining sectors, for the production of several compounds.


2.1 Chemical Sectors

In the chemical sectors catalysts are used to get:

  • Xylenes a mixture of aromatic hydrocarbon molecules obtained from petroleum naphtha and to lesser extent from pyrolysis gasoline (by-product from ethylene plant) and coal liquids from coke.[8] The mixture is rich in m-xylene (50-60%), but the most important is para-xylene (20-25%)[9] used for the production of polyester fibres[10], resin and films. Referring to p-xylene is usually obtained by crystallization or adsorption on molecular sieve processes,[11] but it’s difficult to separate it from other isomers (very close boiling points). Therefore, toluene disproportionation and methylation are also used. Both technologies exploit zeolite catalysts (i.e. ZSM-5) and allow to have high selectivity to p-xylene. Toluene disproportion produces, from two molecules of toluene, one of xylene and one of benzene while the toluene methylation produces, from the reaction of toluene and methanol, water and xylenes.[12]
  • Ethylbenzene is used for the production of styrene, a chemical compound employed to synthetize thermoplastic polymers and elastomers (8) Usually, ethylbenzene is obtained by means of alkylation where ethylene reacts with benzene on acid catalysts. Transalkylation is also used to improve process yield by converting polyalkylbenzenes (PBE), a by-product, into ethylbenzene.[13]Figure 2illustrates the process developed by Polimeri Europa (now Versalis). The system uses the proprietary zeolite Beta-based catalysts: PBE-1 for the alkylation section and PBE-2 for the transalkylation section.[14]

fig.02 bis

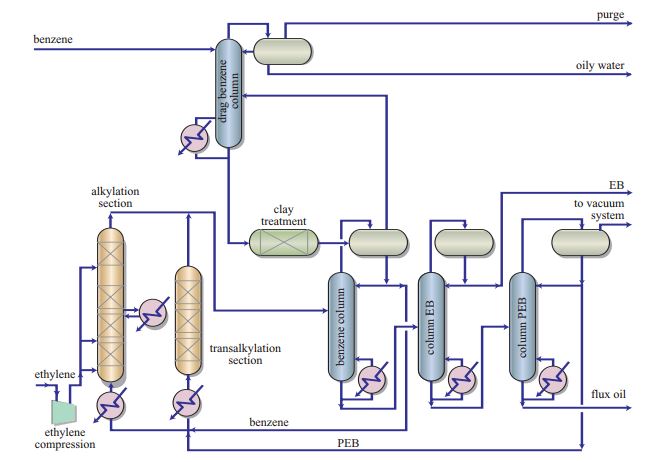
Figure 2 – Production of Ethylbenzene from Polimeri Europa (Versalis since 2012)(8)


  • Cumene is used for phenol and acetone production. It is obtained from the catalytic alkylation of benzene with propylene. The most common catalysts are based on Solid PhosphoricAcid (SPA)housed in fixed-bed reactors operating at 180-240°C and 3-4 MPa. However, the release of free acids causes problems of corrosion.8Hence, new zeolite-based catalysts have recently been launched. The UOP, for example, has developed the Q-MaxTM Process[15] shown in Figure 2, where zeolite catalysts are used for both alkylation and transalkylation reactors. These compounds are regenerated after three cycles.


fig.03

Figure 3 – Q-MaxTM Process developed by UOP15


In the process, a depropanizer and diisopropylbenzene (DIPB) column are used. The former allows to remove propane from alkylation reactor effluent while the last separates DIPB from heavy aromatics. A transalkylation reactor, in which DIPB reacts with benzene, is also used to improve the yield of cumene.

2.2 Refining

Catalyst technologies are used in refining processes such as:

  • Hydrotreating used to remove sulphur, nitrogen, oxygen olefin and metals from distillate fuel such as naphtha, diesel, kerosene by means of hydrogen at high pressure and temperature by means of catalysts. These cylindrical catalysts are metal oxide-based (NiMo,CoMo or MoO3, WO3) on alumina supports.[16] Table  1 summarizes the main physical properties.


 tab.1

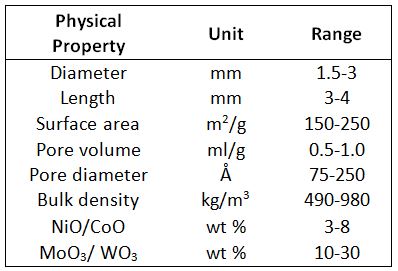
Table 1– Physical Property of NiO/CoO and MoO3/WO3 catalysts (values from[17])


  • Catalytic Reforming is used to transform heavy naphtha in gasolinewith high octane ratings by means of fixed bed reactors. Catalysts can be platinum-based or mixtures of it on alumina support (Pt/Al2O3, Pt-Re/Al2O3, Pt-Ti/Al2O3).[18] Before catalytic reforming the feed is hydrotreated to remove sulphur and nitrogen that poison the active catalyst sites.
  • Isomerization of light naphtha allows to improve octane ratings of C5,C6 hydrocarbon up to 10-20 times. Chlorided alumina, zeolite, and sulfated oxide are the most common catalysts. The first one has high activity and high isomerate yields, but is sensible to poisoning, hence chloride addition is necessary. Zeolite and sulfated oxide can be regenerated but has less activity and require high H2/hydrocarbons ratios.[19]
  • Synthetic Fuels are obtained from syngas, a mixture of CO+H2. In Fischer-Tropsch Synthesis, syngas is converted into hydrocarbons blends that are further refined to produce gasoline. The process uses transition metal catalysts such as iron or cobalt. In the presence of iron catalysts, the water produced from the reactions are converted in CO2 e H2 by means of water gas shift reaction. The temperature and operating pressure are between 200-350°C and 20-50 bar respectively. Syngas is also used to produce methanol by means of catalysts such as Cu/ZnO/Al2O3 at 225-275°C and 50-100 bar[20].ExxonMobilhas developed a process to convert methanol to gasoline (MTG), as shown in the Figure 4, methanol is vaporized and introduced into a DME reactor. The effluent, a mixture of methanol/DME, is sent to MTG reactors in which is completely dehydrated by means of own catalysts, producing gasoline. Gasoline enters Deethanizer and Stabilizer reactors where fuel gas and LPG fractions are removed. Then, stabilized gasoline is split into light and heavy gasoline; the last stream is treated to reduce the amount of Durene.
 fig.04 bis


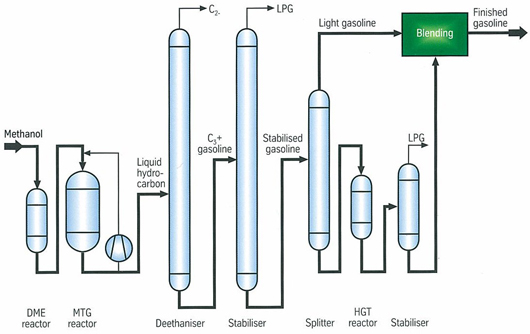
Figure 4– Methanol to Gasoline ExxonMobil Process[21]


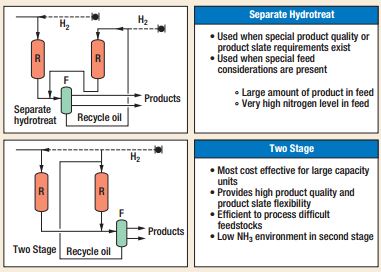
  • Catalytic Dewaxing is a process that improves cold flow of middle distillate feedstocks. Commercially there are two different configurations depending on the catalysts used. For example, if catalysts are based on Ni, Co/Mo or Ni/Mo, a single stage is adopted. The stacked beds of hydrotreating(to remove sulphur and nitrogen) and dewaxing are placed on the top/bottom of the reactor according to the raw materials. Whereas, in the presence of noble-metal catalysts, a double stage is used because a severe hydrotreating is required. The former consists of stacked beds of hydrotreating while the last is a dewaxing stage[22]. Shell has developed a proprietary catalyst formulation (SDD),for dewaxing stage, that allows to remove “wax” converting it in isomerized and cracked molecules. The single stage uses SDD-800 that reduces the loss of distillate and increases the activity of the catalyst before regeneration. The catalyst can operate under high concentration of H2S and NH3. The double stage, instead, adopts SDD-821 a noble metalcatalyst that increases yield, but require slow percentages of H2S and NH3.[23]


3.R&D in Catalytic Technologies

Catalysts allow to reduce the temperature/pressure of the reaction decreasing the amount of fuel, feedstock and expensive materials involved in the processes. Therefore, is crucial to develop new catalysts and optimize the existing ones. When a new catalyst is synthesized, the first step is to select the chemical elements by means of mathematical algorithms and discard thosewho are not suitable. For example, choosing 50 chemical compounds the possible combination are thousands from 1,255 for binary up to 230,300 quaternary combination[24]. Before commercialization, the synthesised catalyst is tested on laboratory scale and then into a pilot plant under different operating conditions. The reactors (fixed, fluidized bed reactors etc.) used in the experimental tests affect the shape and texture of catalysts (pellets, spherical, granular particles etc.). In the following section, for example, the most recent catalysts developed by BASF and Clariant are described:

  • FortressTM NXT is the catalyst worked out by BASF for Fluid Catalytic Crackyng (FCC). It allows to increase metals passivation reducing coke and hydrogen production.[25]
  • PolyMax 850 is launched by Clariant. It is a new phosphoric acid that converts olefins to gasoline and solvents. The catalyst allows to reduce CO2 emissions of about 100,000 tons compared to common ones. It can be recycled and use as fertilizer or phosphoric substance.[26]


fig.05

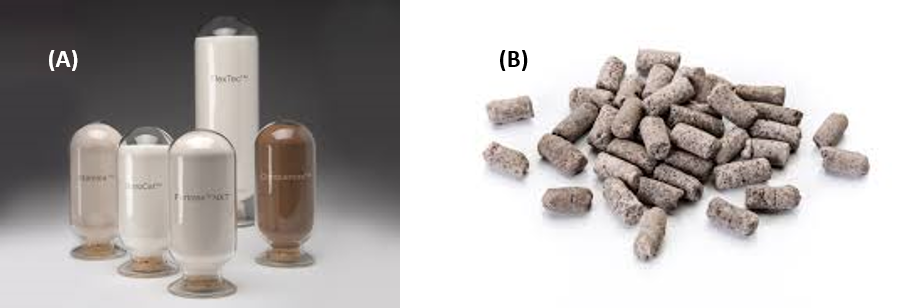
Figure 5 – (A) FortressTM NXT (25), (B) PolyMax 850 (26)


4.Conclusions

From the first large-scale plants for the production of sulfuric acid in 1875, catalysts have been a fast diffusion in the industrial processes.[27] In the chemical sectors they are used for the production of several compounds such as xylene, ethylbenzene, cumene and so on. In refining processes, they are used in hydrotreating, catalytic reforming, isomerization synthetic fuels, catalytic dewaxing etc. Nowadays about 80-90%24 of chemical processes adopt catalysts (mainly heterogenous catalysts) and the global market for the production/regeneration reach billions of US$. Therefore,is necessary to develop new catalysts and optimize the selectivity and activity of existing ones by reducing the deactivation processes.


[1]http://www.essentialchemicalindustry.org/processes/catalysis-in-industry.html
[2]https://www.britannica.com/science/catalysis/Classification-of-catalysts
[3]http://www.mdpi.com/2073-4344/5/1/145/htm
[4]https://www.bccresearch.com/market-research/chemicals/catalyst-regeneration-global-markets-chm046c.html
[5]http://www.grandviewresearch.com/press-release/catalyst-market-analysis
[6]http://www.arabianoilandgas.com/article-9496-top-10-catalysts-companies/
[7]http://www.arabianoilandgas.com/article-9496-top-10-catalysts-companies/1/print/
[8]http://www.treccani.it/export/sites/default/Portale/sito/altre_aree/Tecnologia_e_Scienze_applicate/enciclopedia/inglese/inglese_vol_2/591-614_ING3.pdf
[9] C. Perego and P. Pollesel, Chapter 2 – Advances in Aromatics Processing Using Zeolite Catalysts, Advanced in Nonporous Material 2010, 1, pp 97-149.
[10] https://www.plasticoncomposites.com/composites-material/frp-material
[11] http://egon.cheme.cmu.edu/Papers/rlima_grossmann_aichej.pdf
[12]M. T. Ashraf, Process of pXylene Production by Highly Selective Methylation ofToluene,Industrial Engineering Chemical Research2013, 52 (38), pp 13730–13737.
[13]I. M. Gerzeliev et al., Ethylbenzene Synthesis and Benzene Transalkylation with Diethylbenzenes on Zeolite Catalysts, Petroleum Chemistry 2011, 51(1), pp39-48.
[14]https://www.versalis.eni.com/irj/go/km/docs/versalis/Contenuti%20Versalis/IT/Documenti/La%20nostra%20offerta/Licensing/Stirenici/ESE_Tecniche_Ethylbenzene_130314.pdf
[15] http://www.dequi.eel.usp.br/~barcza/CumenoUOP.pdf
[16] S. Parkash, Refining Processes Handbook, Gulf Professional Publishing, 2003.
[17]J.Ancheyta and J. G. Speight, Hydroprocessing of Heavy Oils and Residua, CRC Press Taylor & Francis Group 2007.
[18] http://nopr.niscair.res.in/bitstream/123456789/17620/1/JSIR%2062%2810%29%20963-978.pdf
[19] G. ValavarasuCorporate R&D Centre, Hindustan Petroleum Corporation Limited , Bangalore , India and B. Sairam,R&D Centre, Chennai Petroleum Corporation Limited , Chennai , India Light Naphtha Isomerization Process: A Review, Journal Petroleum Science and Technology 2013, 31(6), pp 580-595.
[20]http://www.syngaschem.com/syngaschem
[21] https://www.netl.doe.gov/research/coal/energy-systems/gasification/gasifipedia/methanol-to-gasoline
[22]C. Perego et al., Chapter 19Naphtha Reforming and Upgrading of Diesel Fractions, Zeolites and Catalysis
Synthesis, Reactions and Applications,edited by Jiri Cejka et al., WILEY-VCH 2010, pp 585-622.
[23] http://www.shell.com/business-customers/global-solutions/refinery-technology-licensing/catalytic-dewaxing.html
[24] M.Baerns and ‎M.Holeňa, Combinatorial Development of SolidCatalytic Materials, Design of High-Throughput Experiments,Data Analysis,Data Mining, Imperial Collage Press 2009.
[25] https://www.basf.com/en/company/news-and-media/news-releases/2017/11/p-17-359.html
[26] https://www.clariant.com/en/Corporate/News/2017/03/Clariant-launches-PolyMax-850-catalyst-for-more-profitable-and-sustainable-fuel-upgrading
[27]C. H. Bartholomew and R. J. Farrauto, Fundamentals of Industrial Catalytic Processes, Second Edition Wiley-Interscience, 2006.


Latest Advances in Computational Chemistry for Petroleum and Petrochemical Processing

Author: Marcello De Falco – Associate Professor –University UCBM – Rome (Italy)


1.Theme Description

The use of software for the solution of complex problems is dating in 1960s. Since then, computational chemistry grew up quickly by means of increasingly powerful computers:[1]

  • in 1966 Simulation Science launched PROCESS a program for simulating distillation columns;
  • in 1969 DESIGN, a flow-sheeting program for oil and gas processes, was commercialized;
  • in the 1970s FORTRAN became the programming language of engineers;
  • in 1976 the US Department of Energy of Massachusetts commercialized the simulation program ASPEN;
  • In 1982 was launched the first Personal Computer, IBM 5150;

Since 1990s PC programs have played a key role and nowadays are widespread in petroleum and petrochemical processing. In the following section the basis of computational chemistry and the principles of the main commercial software are described.


2.Computational Chemistry

Computational Chemistry is part of the chemistry that uses mathematical models to be simulated on the computers:

  • determining the physical properties of streams;
  • improving the efficiency of the processes by means of sensitivity analysis;
  • describing new compounds and materials.

The methods on which models are based can be divided in: Classical Computational Methods and Computational Quantum Chemistry.


2.1 Classical Computational Method

These methods are based on the law of classical mechanics and include:

  • Molecular Mechanism (MM)[2] describes the molecules as a collection of balls held together by springs. The balls represent the atoms while the springs the chemical bonds. The model minimizes the molecular potential energy to find bond lengths, angles and dihedrals. Often is called force field method and allows to describe molecules with thousands of atoms.


fig. 01rappres of a molec


Figure 1 – Schematic Representation of a Molecule (2)


  • Molecular Dynamics (MD)[3] describe vibrational/Brownian motion of a molecule. The momentums and forces of each atom are obtained by choosing the initial position and velocity of them. Then, new positions and velocity of molecules are processed by the information obtain in the previous step. The trajectory, the energy levels and conformation of substances are computed by iterating the algorithm. This method is suitable for protein application.
  • Monte Carlo Simulation (MC)[3] unlike molecular dynamics, this method is not deterministic, but is based on statistical distribution. Indeed, after choosing the initial position of the atoms and computing the energy of the system, the movement of itis selected randomly. The new configuration is accepted if the system reproduces a Boltzmann distribution. Otherwise another trajectory or the previous position are used until the system is balanced.


2.2 Computational Quantum Chemistry

These methods are based on the law of quantum mechanics and include:

  • Ab Initio[4], solves the Schrödinger equation giving the position of atoms, the electronic energy and density. It is based on the method of Hartree–Fockthat doesn’t take into account the electron correlation. Therefore, it can be used only in few cases. Several methods have been introduced to overcome this restriction (Moller-Plesset perturbation theory, Coupled Cluster, Multireference perturbation method sand etc.)
  • Semi-empirical Quantum Mechanism[5] treats only the valence electrons by ignoring some integrals. The errors due to the approximation are reduced by empirically parameters.
  • Density Functional Theory (DFT) is based on Hohenberg–Kohn theorem. It represents the total energy of the system as a function of the electron energy. In this way is possible to solve the problem by knowing of three coordinates instead of 3N coordinates of the electrons.4

A combination of Quantum Mechanism and Molecular Mechanism is used to describe reaction in a condensate phase. A small part of the system is treated with Quantum Mechanism that takes into account the new configuration of electrons due to chemical reactions. The rest is treated with Molecular Mechanism that allows to describe the molecular geometry.[6]


2.3 Computational chemistry in Industrial Processes

Process simulation started in the 1966 when Simulation Science launched the program PROCESS (today PROII) for the simulation of distillation columns. Nowadays is widespread due to the possibility to simulate steady state and dynamic. Steady state is used for equipment design, debottlenecking of plants while dynamic simulations are used to reproduce start-up, shout-down, disturbances, operability etc.[7]

The main software use in Industrial Processes are based on two techniques [8]:

  • Sequential Modular Approach (SM) divides the flowsheet in a series of block that need to be solved in series. In the presence of recycle streams a “tear stream approach” is used.8


fig. 02

Figure 2 – Sequential Modular Approach [9]


The tear stream approach gives an initial value to the stream; in this way the blocks can be solved sequentially. Then the initial choice is checked by an algorithm, until converge is reached. The method is suitable for steady-state simulation, but it is time-consuming for very complex systems.

  • Equation-Oriented Approach (EO) all the equations used in the software are solved simultaneously. It is suitable for object-oriented model approach and can simulate steady state (nonlinear, algebraic equation) and dynamics (differential equation).

fig. 03

Figure 3 – Equation Oriented Approach (9)

The combination of the two models (SM & EO) is called Simultaneous Modular Approach.


2.4 Main Commercial Software

In this section, the main commercial software are listed:

  • AspenPlus is one of the packages developed by AspenTech[10]. It’s widespread in petrochemical and pharmaceutical processes. It has a database of about 5900 components from NIST. It can be integrated with cost analysis, heat exchanger design software and can be interfaced with Microsoft Excel by means of Visual Basic. It allows to make stead-state/dynamics simulation taking into account non-ideal and solid system.[11]
  • DESIGN II for Windows produced by WinSim Inc.[12] is suitable for petrochemical processes. Indeed, it includes more than 60 thermodynamics methods, 1200 components and 38 worlds crude oils. Other compounds can be added with ChemTran that allows also to calculate non-ideal property of mixtures. It’s automatic linked with Microsoft Excel, Visual Basic, Visual C++ interfaces and allows to use FORTRAN commands to define specific options.


fig. 04

Figure 4 – Refinery flowsheet with Design II for Windows[13]


  • SimSci PRO/II is owned by Invensys SimSci[14]. It allows to simulate steady-state processes in refining, polymerization and pharmaceutical applications. It performs rigorous mass and energy balance. Nowadays it includes also Spiral Crude Suite a package that features crude feedstock in detail. In this way more rigorous models are obtained.1
  • ChemCAD commercialized by Chemstations Inc.[15] includes several packages that allow to design new processes or improve existing ones. Indeed, wide thermodynamics data and unit operations cost are available. Furthermore, it’s possible to simulate steady state and dynamics such as operability of the plants, loops control, operator training etc.
  • gPROMS developed by PS Enterprise[16] is based on Equation Oriented approach. It allows to write differential equations, physical and chemical properties in the gProms model Builder. The resulting model is matched with experimental data to adjust the parameters. It can interface with Excel, Matlab and FLUENT environments. It is suitable to describe gas separation processes, crystallization, polymerization, fix bed reactors etc.11


fig. 05

Figure 5 – gPromsprocess Builder (16)


3.Conclusions

Since 1960s computational chemistry (classical and quantum) has played a pivotal role in solving complex problems. Nowadays commercial programs are based on two mathematical models: Sequential Modular Approach (SM) and Equation Oriented Approach (EO). The SM is suitable for steady state solution, while the EO for dynamics processes and real-time optimization. There are several software (Aspen Plus, PRO/II, gProms etc.) that can reproduce the main petroleum and petrochemical processes; but despite there are more powerful PC, some simulations are time consuming. Therefore the future challenge is to reduce this time ever more and integrate different modelling components and environments through a standard interface (i.e. CAPEN-OPEN project[17]).


[1]A.Dimian et al., Integrated Design and Simulation of Chemical Processes, Volume 13 2nd Edition, Elsevier Science 2014.
[2]E. G. Lewars,Computational Chemistry, Introduction to the Theory and Applications of Molecular and Quantum Mechanics, Kluwer Academic Publishers, 2003.
[3]D. C. Young, Computational Chemistry, A Practical Guide for Applying Techniques to Real-World Problems, WILEY-INTERSCIENCE, 2001.
[4] http://www.pnas.org/content/102/19/6648.full#ref-4
[5]W. Thiel, Semiempirical quantum–chemical methods, WIREs Computational Molecular Science 2013, 4, pp 145-157.
[6] https://www.mpibpc.mpg.de/9638776/Groenhof_2013_Meth_Mol_Biol.pdf
[7]https://www.ncbi.nlm.nih.gov/books/NBK207665/
[8] D.C.Y.Foo, RafilElyas, Introduction to Process Simulation, Chapter1, Chemical Engineering Process Simulation
1st Edition, ICHEM 2017.
[9] https://www.psenterprise.com/concepts/equation-oriented
[10] http://home.aspentech.com/
[11]R.Gani, Process Systems Engineering, 2. Modelling and Simulation, ULLMANN’S Enciclopedia of Industrial Chemistry, 2012.
[12] https://www.winsim.com/design.html
[13] https://www.winsim.com/media/refinery.png
[14] http://software.schneider-electric.com/products/simsci/design/pro-ii/
[15] http://www.chemstations.com/Why_CHEMCAD/
[16] https://www.psenterprise.com/products/gproms
[17] http://www.colan.org/general-information-on-co-lan/


Improvements and New Technologies for Corrosion Control in Industrial Process Installations

Author: Giovanni Franchi-Chemical Engineer- Cooperation Contract -University UCBM – Rome (Italy)


1.Theme Description

Corrosion is the destructive attack of a metal by chemical or electrochemical reaction with its environment. It’s called “anti-metallurgy” because it tends to bring the metals back to their state of being in nature, mixed with other elements (especially with O2). Deterioration by physical causes is not called corrosion, but erosion, galling, or wear[1],[2].There are different types of corrosion: uniform, pitting, crevice, intergranular, galvanic, etc., and are related to different sectors: infrastructure, utilities, production, manufacturing and transportation .Corrosion costs are due to lost production, health, safety and environmental issues. In the USA, referring only on direct costs, corrosion costs grew up from 276 billion US$ in 1998[3] to 1.1 trillion US$ in 2016.[4]

Table 1 reports the Global Corrosion Costs referring to 2013.

table_1

Table 1 – Global Corrosion Costs (2013)[5]


As can be seen, these costs reached 2.5 trillion US$ corresponding to 3.4% of Global Gross Domestic Product. The Nace International Institute has estimated that the application of techniques for preventing corrosion can save 375-875 billion US$ (15-35% of the total cost).[6]

The following sections described the most common types of corrosion in industrial processes such a soil and gas refining and corrosion due to water and in soil. Finally, methods to prevent and monitoring corrosion are described.


2. Corrosion in Industrial Processes


2.1 Corrosion in Oil and Gas Refining

Corrosion is widespread in oil and gas refining; indeed, refining processes works at high level of pressure and temperature. In addition, due to harmful fluids, specific corrosions (sulfidic corrosion, naphthenic acid corrosion, sour water corrosion etc.) are related.

The European Commission’s report on “Corrosion Related Accidents in Petroleum Refineries” highlights that the most sensitive equipment, in the 99 refineries analysed, is the distillation unit (23% of failures) followed by hydrotreatments equipment (20%); 17% of failures occurred in the pipeline for transport between units, 4% in tubes of heat exchanger and cooling equipment, 15% took place in storage tanks, whereas the rest involved other equipment component like trays, drums and towers.[7]

2.2 Corrosion in Water

Water is very aggressive natural electrolyte for many metals and alloys due to oxygen dissolved. Other elements that affect corrosion are: pH, chloride, Total Dissolved Solids (TDS), hardness and high temperature.

Langelier Saturation Index (LSI) is one of the most common index used to evaluate the water corrosion:

formula

where

  • pHS = pH at saturation conditions.
  • LSI < 0 the water is corrosive and could damage metal surface.
  • -5 < LSI < -3, treatments are recommended.[8]


Local corrosion is accelerated by the presence of nitrates and nitrites.[9]

2.3 Soil Corrosion

Soil corrosivity depends on electrical conductivity, oxygen concentration, salts and acids content. It’s common in storage tanks, cables and pipelines. Soil aeration is a well manner to reduce corrosion because the ground has higher rates of evaporation and lower water retention.[10]


3.Methods for Corrosion Reduction, Measurement and Monitoring

As abovementioned, corrosion costs are very high. Therefore, it is necessary to prevent and monitor the corrosion development during equipment operation.

3.1 Corrosion Prevention

Corrosion could be reduced by using:

  • suitable materials, i.e. titanium alloys in heat exchanger and condenser tubes show a great resistance (Figure 1).[11]


fig.1

Figure 1 – (a) tube bundle (Titanium Gr.12) of overhead vacuum condenser (b) carbon steel shell (c) detail of inlet nozzle corroded by acids gases (11)


  • cathodic protection where the metal that needs to be save is transformed into the cathode in an electrochemical reaction or cell. It’s used to control corrosion in marine environments, but it can’t prevent MIC (Microbiological Influenced Corrosion)[12]. It’s also very common in soil corrosion prevention10;
  • protective coatings like fiberglass-reinforced plastics (FRP). They combine the properties of resin (i.e. polyester, epoxy and vinyl ester) with that of glass fibers. The former allows the chemical resistance while the latter gives mechanical strength and resistance to external damage[13];
  • corrosion inhibitors are usually adsorbed on the surface of the metal forming a protective film.[14]


3.2 Corrosion Monitoring

There are several techniques for corrosion measurements and can be divided into Non- Destructive Techniques and Corrosion Monitoring Techniques[15].

Non- Destructive Techniques are used when it isn’t possible to remove damaged materials and include:

  • X-ray techniques use electromagnetic waves from 1pm to 10nm with energy between 0.1keV and 1MeV. There are different methods such as: X-ray fluorescence analysis (XRF), X-ray diffraction analysis (XRD) and X-ray photoelectron spectroscopy (XPS). The XRF and XPS are very similar, the X-ray energies let to some electrons to jump from the atom as photoelectrons. The generated holes are occupied by nearby shells electrons releasing energy. In the XRF the energy released is measured, while the XPS is measured the energy associated to photoelectrons. The XRD uses waves of 0.1 nm, corresponding to lattice spacing, that are scattered by the electrons in the atoms with a certain angle. By measuring this angle is possible to know the chemical composition of the element.[16]

fig.2


Figure 2 – (a) XRF, (b) XPS where K,L,M represent the energy levels (16)


  • Ultrasonic Technique is an online technique that allows to analyse general and localized corrosion. The system consists of a transducer (a piezoelectric material), the object to be analysed and a liquid placed between them. When the piezoelectric material oscillates, a wave is transmitted into the object. By measuring the time that wave employs to go across the material it is possible to know the thickness. It can detect wall losses of about 0.1 mm.[17]
  • Eddy Current Technique, is used in thin materials (aircraft skin, sheet stock etc.). It uses the principle of electromagnetic inductions where by means of altering currents, eddy currents are induced in the material to be analysed. These currents induce, in turn, an alternating current in the sensor coil. The change of the two current fields let to measure the corrosion rate.16 New techniques have been studied as: Photoinductive Imaging (PI) and Pulsed EddyCurrent (PEC). The former uses an argon ion laser to generate eddy current obtaining a microscopic resolution. The latter uses low frequencies spectrum that allows to have information at different depths.[18]


Corrosion Monitoring Techniques include:

  • Electrical Resistance (ER), an online method that measures the changing in electrical resistance of a conducting elements. Indeed, referring to the second Ohm’s law the resistance of an element is equal to:

form2

where

  • ρ = resistivity;
  • l = element length;
  • S = cross section area of the element.


  • If S decreases due to corrosion, the element resistance increases. By plotting corrosion loss over time, it is possible to work out the corrosion rate.[19] This method can’t be used in liquid metals and conductive molten salts.[20]There are different types of Electrical Resistance on market: wire loop, cylindrical, tube loop, spiral loop, large/small flush and atmospheric.
  • Linear Polarization Resistance (LPR) uses the first Ohm’s law:

form3

where

  • ΔV = difference voltage applied to the electrodes;
  • I = current between the electrodes.


Two or three electrode probes are inserted into the process system. A potential of about 20 mV is applied between the elements and current is measured. This method allows to monitoring general and galvanic corrosion and qualitatively local corrosion like pitting and crevice corrosion[21]. It’s suitable to evaluate corrosion rate in real time.[22]

  • Corrosion Coupons are small bars of same alloy or similar chemical composition of the equipment that is being monitored (i.e. mild steel, copper, stainless steel, nickel, etc.)[23]. They are introduced into the system through a side stream coupon rack.[24]There are several kinds of corrosion coupons: strip, rod, flush disc and disc (Figure 3). Corrosion coupon are certified by its serial number, weight in grams, dimensions, material and surface finish.[25]Referring to corrosion in water, as example, corrosion coupons are removed from coupon rack after 30-90 days and return to laboratory. Where the rate of corrosion is determined from loss of weight (mils/year)[26]. In this way, it is also possible to understand the type of corrosion that occurred.[27]


fig.3

Figure 3 – Different configurations of corrosion coupons from CAPROCO27


3.3 New Approaches in Corrosion Control

Techniques described above are stand-alone methods for corrosion control that don’t allow to monitor corrosion in real time (Figure 4).


fig.4

Figure 4 – Differences between off-line, online and online measurements[28]


In the last few years, with the development of automation and Distributed Control System (DCS) it could be possible to control corrosion in real time and optimize system productivity (Figure 5).


fig.5

Figure 5 – Example of corrosion monitoring integrated with other process variables (28)


However, problems of integrating corrosion measurements within DCS exist due to qualitative and not quantitative measurements (28). Therefore, they can’t be used as process variables that can be manipulated. At the same time there isn’t a method that can evaluate all different kinds of corrosion. Recently new multivariable corrosion transmitter[29] and wireless[30]systems have been developed, but further efforts are needed to reduce the risks of corrosion.

4. Conclusions

Corrosion control is a real problem for industrial processes. It covers all sectors and with reference to hazardous plants such as oil refining, it can create serious damage to environments and people (i.e. Sinopec Gas Pipeline Explosion)[31]. Several methods for corrosion mitigation (cathodic protection, protective coating etc.) and monitoring (eddy current techniques, corrosion coupons etc.) exist.  Despite this, corrosion causes trillion US$ losses. Nowadays these costs are 3-4% of Global Gross Domestic Production. Therefore, is necessary to control corrosion by integrating corrosion transmitters within DCS system (i.e. SmartCET)29 and equipping skilled professionals with the latest generation technologies.


[1] R. Winston Revie, Corrosion and Corrosion Control, An Introduction to Corrosion Science and technology, fourth edition, Wiley-Interscience, 2008.
[2] P. Pedeferri, Corrosione e protezione dei materiali metallici, Polipress, 2010.
[3]https://www.nace.org/Publications/Cost-of-Corrosion-Study/
[4] http://www.g2mtlabs.com/corrosion/cost-of-corrosion/
[5] http://impact.nace.org/economic-impact.aspx
[6] https://www.nace.org/Newsroom/NACE-News/Study-Sets-Course-Toward-Corrosion-Management-Practices-to-Increase-Safety,-Decrease-$2-5-Trillion-Global-Cost-of-Corrosion/
[7]M.H. Wood et al., Corrosion‐Related Accidents in Petroleum Refineries, European Commission Joint Research Centre, 2013.
[8] http://www.water-research.net/index.php/drinking-water-issues-corrosive-water-lead-copper-aluminum-zinc-and-more
[9]B. Valdez et al., Corrosion Control in Industry, Chapter2, Environmental and Industrial Corrosion – Practical and
Theoretical Aspects, Intech 2012. http://dx.doi.org/10.5772/51987
[10] https://www.corrosionpedia.com/an-introduction-to-soil-corrosion/2/1431
[11]A. Groysman, Corrosion Problems and Solutions in Oil Refining and Petrochemical Industry, Springer 2016.
[12]Günter Schmitt, Global Needs for Knowledge Dissemination, Research, and Development in Materials Deterioration and Corrosion Control, World Corrosion Organization, 2009.
[13] https://www.plasticoncomposites.com/composites-material/frp-material
[14]G.Camila, Corrosion Inhibitors – Principles, Mechanisms and Applications, INTECH, 2014. http://dx.doi.org/10.5772/57255
[15]http://www.alspi.com/introduction.htm
[16]H. Kanematsu and D.M. Barry, Corrosion Control and Surface Finishing, Environmentally Friendly Approaches, Springer, 2016.
[17]S. Papavinasam, Corrosion Control in the Oil and Gas Industry, 1st Edition, Gulf Professional Publishing, 2013.
[18] https://www.nde-ed.org/EducationResources/CommunityCollege/EddyCurrents/Introduction/presentstateofET.htm
[19] http://www.caproco.com/catalog/pdf/Probes-Instruments/Electrical-Resistance/Electrical-Resistance-General-Information.pdf
[20] https://www.cosasco.com/corrosion-monitoring-standard-electrical-resistance.html
[21] L. Yang, Techniques for corrosion monitoring, Woodhead Publishing in Materials, 2008.
[22] http://www.alspi.com/lprintro.htm
[23] https://www.cosasco.com/corrosion-monitoring-corrosion-coupons.html
[24] http://www.gwt-inc.com/resources/corrosion-monitoring/
[25] http://www.assetintegrityengineering.com/introduction-corrosion-coupons/
[26] http://www.chemaqua.com/downloads/cases/catb2-009_9-10.pdf
[27]http://www.caproco.com/catalog/pdf/Coupons-Holders/Corrosion-Coupons/Corrosion-Coupons.pdf
[28]R.D.Kane, A new approach to corrosion monitoring, Chemical Engineering, 2007-honeywellprocess.com
[29] https://www.honeywellprocess.com/library/support/Public/Documents/Corrosion_Solution-%20Cooling_Water-70-82-57-24.pdf
[30] https://www.controleng.com/single-article/wireless-based-corrosion-monitoring-system/603fc2cec90abd585879e8ac14ae6efb.html
[31]https://www.nace.org/CORROSION-FAILURES-Sinopec-Gas-Pipeline-Explosion.aspx


New Materials for Emerging Energy Technologies

 Author: Giovanni Franchi-Chemical Engineer- Cooperation Contract -University UCBM – Rome (Italy)


1.Theme description

The European Commission since 2007 with the “Strategic Technology Plan” (Set-Plan) promotes the development of new technologies that allow to improve sustainability and efficiency, reducing costs. It can be achieved by coordinating the national research of European Countries and by financing projects.[1]

With Horizon 2020, EU gives the financial instrument to achieve these goals. Part of Horizon 2020 is the Leadership in Enabling and Industrial Technologies (LEIT)that supports the development of nanotechnologies, advanced materials, manufacturing and processing and biotechnology.[2]

In these context, the most promising energy technologies includes[3]:

  • artificial photosynthesis;
  • piezoelectric materials;
  • thermoelectric structural power materials;
  • low energy nuclear reactions.

The scopes of the innovative materials development is to reduce resources and energy consumption. Indeed, artificial photosynthesis could be used to produce energy from the sun without intermediate energy carriers(just a little part of 120 000 TW/year is use for mankind activities)[4]; thermoelectric generators could be used to convert waste heat into electricity (i.e. in the USA the amount of waste heat is about 36 TWh/year)[5].

In the following sections, the state of the art and the future trends of these technologies are described.


2.Technologies: State of Art and Future Perspectives


2.1 Artificial Photosynthesis

Artificial photosynthesis mimics the natural photosynthesis where chlorophyll uses sunlight to break down H2O molecules into hydrogen, electrons and oxygen. Hydrogen and electrons convert CO2 into carbohydrates, whereas the oxygen is expelled. In the artificial photosynthesis either oxygen and hydrogen could be produced. By this way, hydrogen could be used to produce energy, or to produce artificial fuels as methanol. The main problem of the process is splitting water molecules; the system need the use of catalysts like: manganese, titanium dioxide and cobalt oxide.[6]

Scientists are studying nanomaterials[7]and new processes[8]to improve efficiency. Today the artificial photosynthesis devices are not competitive with conventional energies equipment and tests are performed only in laboratory scale.

In the figures below two different devices are shown:

  • Photo-electrochemical biofuel cell;
  • Water splitting cell.


fig.1

Figure 1 – a)Photoelectrochemical biofuel cell and b) Water splitting cell5


The first system uses sunlight to consume a biofuel (ethanol or methanol) and to generate hydrogen. The anode is a glass covered by a transparent conductor (indium tin oxide or fluorinated tin oxide) formed by a thin layer of nanoparticulate (tin dioxideor titanium dioxide). The electrode is immersed in an aqueous solution of NADH/NAD+. The energy absorbed generates electrons that flow through the cathode (i.e platinum electrode) immersed in the same solution, separated by means of membrane permeable to hydrogen’s proton (H+). Hydrogen or, if oxygen is present, electricity is produced. In the second system, the biofuel is substituted by an oxidant catalyst (IrO2∙nH2O) whereas the NADH solution is substituted by a ruthenium solution. The latter injects electrons on TiO2. These electrons flow through the cathode where hydrogen’s protons are reduced to hydrogen.


2.2 Piezoelectric Materials

Piezoelectric materials are widespread in our life. They are used in cars (fuel injection, airbag, parking sensors) in mobile phones (camera focus), at the hospital (microsurgery) in pressure sensors and transducers. When these materials are subjected to a mechanical stress they generate electric energy proportional to the stress. Vice versa when is applied an electrical field the piezoelectric produce a mechanical energy[9].

fig.2

Figure – Common rail injector10


Nowadays piezoelectric materials can be divided into three groups:

  1. natural crystals (quartz);
  2. ceramics (lead zirconate titanate, PZT);
  3. polymers (polyvinylidene fluoride, PVDF).

Quartz has the highest quality factor (parameter that characterizes the sharpness of electromechanical resonance spectrum) suitable for loss transducers, whereas PZT has the highest electromechanical coupling factor (correspond to the rate of electromechanical transduction) and piezoelectric strain constant (measure the rate of strain due to an external electric field) suitable for high power transducer. PVDF has high voltage constant and mechanical flexibility, so it’s suitable for pressure/sensor applications[10].

The most used is the lead zirconate titanate (Pb(Zr,Ti)O3) and the challenge is to find new materials because this alloy contains 60% in weight of lead (expensive material).4


2.3 Low Energy Nuclear Reactions

In 1989, Stanley Pons and Martin Fleischmann demonstrated, in a small-scale laboratory, high release of heat, without radiation,by electrochemical charging of deuterium into palladium. This is called “cold fusion”. Nowadays cold fusion is included in the class of Low Energy Nuclear Reactions (LENR) and other materials have been found to produce the same effect(lithium and nickel).[11]

Instead of hot fusion, LERN necessities of solid materials and it doesn’t need a high flux of neutrons. The heat released is a function of deuterium concentration into palladium (this phenomenon is observed only if D/Pd> 0.9) hence a property metallurgy needs to be find.4A first nuclear reactor is under construction (ITER project[12])

The following table shows the main experiments and materials.

Electrochemical loading is mainly based on Pd/alloys with deuterons from heavy water because it is the system used in Fleischmann and Pons experiments. But, Ni/alloys with protons from hydrogen gas, are preferred for gas loading.

Tab.1

Table – LERN experiments[13]


One of the most promising experiments is Rossi’s E-Cat reactor. An external heat (electric or fossil) is applied in reaction chamber. The reactions begin when reactor temperature reached 60 °C and produce a large amount of heat (more than the energy input). This energy can be used to heat water and to produce steam. When the reaction is stable the external heat can be turned off and the reactions continue for hours. The first plant (1MWth) was tested in Bologna on October 28th, 2011. It ran for 5.5 hours producing 479 kWe.

It is being tested small E-Cat reactors, 10-20 kW, for domestic market (Rossi’s LeonardoCorporation).[14]

fig.3

Figure – 1MWth E-Cat experimental apparatus[15]


2.4 Thermoelectric Generators

A thermoelectric system uses the Seebeck effect that allows to generate electrical power from a temperature gradient. The system consists of couples of semiconductors n-pconnected electrically in series and thermal in parallel. When a gradient temperature is applied, mobile electrons move from hot side (semiconductor n) to cold side (semiconductor p) where there are free holes. The net charge produces an electrostatic potential.

fig.4

Figure – Thermoelectric Generators[16]


The efficiency is estimated by means of a dimensionless group (figure of merit):

formula

  • α = Seebeck coefficient;
  • σ = electrical conductivity;
  • k = thermal conductivity;
  • T = absolute temperature.

Therefore, materials should have high Seebeck coefficient and electrical conductivity and small thermal conductivity.

Nowadays, materials used for this application are divided into three groups depending on the temperature[17]:

  1. bismuth telluride (Bi2Te3) at low temperature (< 400 K);
  2. lead telluride (PbTe) at middle temperature (600-900 K);
  3. silicon germanium (SiGe) at high temperature (> 900 K).

In the figure is reported the history of thermoelectric materials from 1960 up to now. There are three different regions:

  • ZT ~ 1 and efficiency reached 4-5%
  • ZT ~1.7 by the introduction of nanostructures and efficiency of 11-15%
  • ZT > 1.7 and efficiency near 15-20%.

The most useful between these materials is Bi2Te3 but this alloy is toxic for the environmental. For thisreason, alloys ofMg2Si, CoSb3, ZnSb,ZnO have been studied to find a new class of materials.4

fig.5

Figure – History of thermoelectrical materials from 1960 to 201617


3.Conclusions

These technologies are part of low-carbon energy technologies and are well within European “2050 Energy Strategy”. This strategic plan aims to reduce greenhouse gas emissions by 80-95% compared to 1990 levels, by 2050.[18]

Further R&D efforts need to be made on new materials that could allow their commercialization. Indeed, regarding to artificial photosynthesis innovative materials and low-cost fabrication technique are introduced (i.e.hydrothermal and chemical vapor deposition)7. However, the experimental tests are carried out on laboratory scale. Piezoelectric materials are widespread, but new alloys with less lead content are necessary. LERN’s experiments are difficult to reproduce, control and tests are related to few hours of continues operation. Thermoelectric materials have low efficiencies therefore new alloys are necessary to improve the figure of merit (ZT).


[1]https://ec.europa.eu/energy/en/topics/technology-and-innovation/strategic-energy-technology-plan
[2]http://ec.europa.eu/programmes/horizon2020/en/h2020-section/nanotechnologies-advanced-materials-advanced-manufacturing-and-processing-and
[3]European Commission, Forward Looking Workshop on Materials for Emerging Energy Technologies, 2012.
[4]Gust et al., Solar fuels via artificial photosynthesis, Accounts of Chemical Research 2009, 42(12), pp 1890-1898.
[5]H. Alama, S.Ramakrishna, A review on the enhancement of figure of merit from bulk to nano-thermoelectric materials, Nano Energy 2013, 2(2), pp 190-212.
[6]http://science.howstuffworks.com/environmental/green-tech/energy-production/artificial-photosynthesis.htm
[7]I. Tachibana et al., Artificial photosynthesis for solar water-splitting, Nature Photonics 2012, 6(8), pp 511-518.
[8] http://www.fujitsu.com/global/about/resources/news/press-releases/2016/1107-02.html#2
[9]J.Holterman and  P. Groen, An Introduction to Piezoelectric Materials and Applications, Stichting Applied Piezo, 2013.
[10]K. Uchino, Advanced Piezoelectric Materials: Science and Technology,second edition, Woodhead Publishing, 2017.
[11]J. R. Pickens, D.J. Nagel, The status of low energy nuclear reactions technology, 2016, etcmd.com
[12] https://www.iter.org/proj/inafewlines
[13] D.J. Nagel, Evidence of Operability and Utility from Low Energy Nuclear Reaction Experiments, 2017, NUCAT Energy LLC.
[14] http://e-catworld.com/what-is-the-e-cat/
[15] E-Cat Australia Pty Ltd, E-CAT-a paradigm shift in green energy production, www.E-catAustralia.com
[16]G.J.Snyder and E.S.Toberer, Complex thermoelectric materials, Nature materials 2008, 7, pp 105-114.
[17]X. Zhang, L-D.Zhao, Thermoelectric materials: energy conversion between heat and electricity, Journal of Materiomics2015, 1(2), pp 92-105.
[18] https://ec.europa.eu/energy/en/topics/energy-strategy-and-energy-union/2050-energy-strategy


Carbon Dioxide Recycling

Author: Vincenzo Piemonte, Associate Professor, University UCBM – Rome (Italy)


1.Theme description

Nowadays, CO2 recycling is one of the possible contributions to CO2 mitigation and an opportunity to use a low-cost (or even negative-cost, when considering taxes on emissions) carbon source.

CO2 recycling introduces a shorter path (in terms of time) to close the carbon cycle compared to natural cycles and/or an additional way to store CO2 in materials with a long life-time; in addition, it is a way to store renewable energy sources and/or use an alternative carbon source to fossil fuels. Moreover, CO2 recycling produces valuable products that can be marketed and thus add economic incentives to the reduction of CO2 emissions, while options such as storage only add costs. Carbon capture and recycling (CCR) avoids also the costs associated with transporting CO2.

Recycling of CO2 is therefore a possible contributor, together with other technologies, to a solution for the global issue of GHG emissions, but has only started to be considered in detail in recent years.

The lifetime of the products of CO2 conversion is another important aspect (see figure 1). The IPCC report on CO2 capture and storage[1] selected as a crucial parameter the time lapse between the moment of CO2 conversion into a product and CO2 release back into the atmosphere. A long lifetime of the CO2-based product will fix the molecule for a long time, thus preventing its (re-)release into the atmosphere. Most product lifetimes range between several months and a few years, with the exception of inorganic carbonates and polymers based on organic carbonates that store CO2 from decades to centuries.

CCR can be also viewed as a way to introduce renewable energy into the chemical and energy chain[2], by storing solar, geothermal, wind, or other energies in chemical form. The resulting chemical facilitates storage and transport of energy, and is particularly important if it is compatible with the existing energy infrastructure and/or can be easily integrated into the existing chemical chain. Therefore, recycling CO2 is an opportunity to limit the use and drawbacks of fossil fuels, while avoiding the high costs (including energy) associated with a change in the current energy and chemical chain. In considering CO2 recycling, the effect is thus not only direct, that is, subtraction of CO2 from emissions, but a combination of direct and indirect effects that amplifies the impact.  Finally, CO2 finds utilization when there is a profitable cost/benefit trade-off linked to CO2 (re)using in place of the existing technology, regardless of any considerations linked to capture and storage policies.

In the following, the emerging large-scale CO2 conversion routes will be shortly analysed.


fig.1
Figure 1 – Summary of the different options for CO2 the valorization[3].

Notes: Necessary timeframe for development: 1 More than 10 years → 4 Industrial; Economic Perspectives: 1 Difficult to estimate→4 Available industrial data; External use of energy: 1 Difficult to decrease→4 No need; Volume CO2 (potential): 1 Less than 10 Mt→4 More than 500 Mt; Time of sequestration: 1 Very short→4 Long term; Undesirable impacts on environment (utilization of solvents, utilization or production of toxic or metallic compounds, utilization of scarce resources): 1 Significant→4 Low.


2.Non Biological Route

The CO2 recycling by non biological route can be divided in three different sub-routes, that is Inorganic reactions, Organic reactions and Syngas production with further conversions.

2.1 Inorganic Reactions

Mineral carbonation, that is, the formation of carbonate from naturally occurring minerals such as silicate-rich olivine and serpentine, is an already well-recognized carbon storage option[4].

Calcium carbonate is a key product, for example of the Solvay process for production of Na2CO3 and NaHCO3, and can be mined as limestone. An extensive market exists also for synthetic or precipitated calcium carbonate for applications in the paper industry, plastics, rubber and paint products, with an estimated global market of more than 15 Mt a−1 [5]

One of the most promising process devoted to convert CO2 from flue gases in bicarbonate is the Skyonic’s patented CO2 mineralization process Skymine[6],  the first for-profit system converting flue gas CO2 into bicarbonate (baking soda) as main commercial product.  25 million US$ have been financed by the US Department of Energy (DoE) in 2010, to support the industrialization of this carbon capture technology that can be retrofitted to existing plant infrastructures.

Another project (Calera project) has also been selected in the same 2010 funding act (DoE share 20 million US$), and focuses on the production of  mineral end-products as building materials, such as carbonate-containing aggregates or supplementary cement-like materials. Inspired by the biogenesis of coral reef, the heart of the technology coarsely consisted of precipitating captured CO2 as novel (meta)-stable carbonates and bicarbonates with magnesium- and calcium-rich brines; the CO2 would originate from captured flue gas—from fuel combustion or other large plants—and the brine from seawater or alkaline industrial waste sources[7]

formula 1


formula 2


2.2 Organic Reactions

The synthetic routes from CO2 to organic compounds that contain three or more carbon atoms number in the tens, as extensively reviewed[8],[9],[10],  but only five are earmarked as industrialized. Figure2 is an overview of some of the possible organic chemicals produced from CO2. Among these one, the most important are Urea, Acrylates, Lactones, carboxylic acids, Isocyanates, Polycarbonate via monomeric cyclic carbonate, Alternating polyolefin carbonate polymers, Polyhydroxyalkanoate, Polyether carbonate polyols and Chlorinated polypropylene.

fig.2

Figure 2 – A summary of organic chemicals produced from CO2[11].


2.3 Syngas formation and further conversion

The chemical reduction of thermodynamically stable CO2 to low-molecular-weight organic chemicals requires high-chemical-potential reducing agents such as H2, CH4, electrons, and others. The hydrogenation of CO2 can be connected to the well-established portfolio of chemicals synthesized from syngas (CO/H2) via the reverse water–gas shift (RWGS) reaction, where methanol, formic acid, and hydrocarbons emerge as the three main products of interest (see figure 3).

Methanol is one of the chemicals with the largest potential to convert very large volumes of CO2 into a valuable feedstock. It is already a commodity chemical, manufactured on a large scale (40 Mt in 2007)[12] mainly as a feedstock for the chemical industry towards chemicals such as formaldehyde, methyl tert-butyl ether (MTBE), and acetic acid, which makes CH3OH a preferable alternative to the Fischer–Tropsch (FT) reaction, due to the broader range of chemicals/products, and hence their application fields as well as higher productivity.

An alternate source of reducing hydrogen can be methane. The complete hydrogenation of CO2 to methane is the Sabatier reaction:

In terms of hydrogen consumption, and hence overall energetics, CO2 reduction to methanol rather than to methane might appear favorable given the better ratio by energy value of the product relative to the starting H2; nevertheless, specific conditions (for example, the need to produce substituted natural gas; SNG), know-how, and other local conditions have spurred industrial applications of the Sabatier reaction.

formula 3


fig.3


Figure 3 – CO2 routes to chemistry and energy products via syngas


3.Biological route

Photosynthesis is the largest-scale CO2 conversion process, since it is present in all plants and photosynthetic micro-organisms (including microalgae and cyanobacteria).

In terms of CO2 consumption, a total of 1.8 tons of CO2 is needed to produce 1 ton of algal biomass[13]. Microalgae need also nitrogen and phosphorus nutrients. The integration of chemicals and energy production in large scale industrial algal biofarms has led to the “algal biorefinery” concept[14]. The chemical products of the biorefinery include carbohydrate and protein extracts, fine organic chemicals (e.g., carotenoids, chlorophyll, fatty acids) for food supplements and nutrients, pharmaceuticals, pigments, cosmetics, and others, along with energy fuels, for example, biodiesel, bioethanol, and biomethane. The biochemical conversion finalized exclusively to energy (e.g., anaerobic digestion, alcoholic fermentation, photobiological hydrogen production) has recently been reviewed by Brennan and Owende[15].

Thus, even if current stage of development in algal carbon capture at large emitter sites indicates an economic cost that is still too high, there are signals of a fast scientific and technological development in this area, including improvements in:

  • photobioreactor design (e.g., surface area, light path, layer thickness)[16];
  • harvesting and processing technologies, including substantial simplification due to self-excreting algae[17];
  • photosynthetic efficiency, productivity, compatibility with concentrated CO2 streams, and tuning to desired end-product by genetic engineering[18]

Another interesting technology is “The power-to-gas technology” which is being explored mainly with a focus to store renewable energy, and project developers so far tend to use CO2 from biogas as carbon source for methanation and hydrogen may also be directly mixed with biogas (see figure 4). Although these plants might provide very useful insights into the options of CO2 capture, methanation, and hydrogen storage, biogas as a carbon source may prove only sustainable if derived from (wet) waste and sewage[19].

In the same field is active the INPEX society with an interesting research which involves injecting CO2 into the ground by using CCS or CO2 Enhanced Oil Recovery (EOR) for the purpose of producing methane by microbes that live in oil and gas fields and water bearing strata (see figure 5). A constant supply of hydrogen is vital to microbes survival. INPEX has performed indoor experiments that use the power of electrochemical hydrogen reduction stage. The research has confirmed electrochemical methane production activation by microbes, including the microbes that lives in oil field in Japan[20].


fig.4

Figure 4 – Power-to-gas technology scheme


fig.5

Figure 5 – INPEX project


To conclude, optimistically, assuming that all the options for CO2 utilization can be fully implemented and considering that the use of CO2 as carbon source partly prevents the use of fossil fuels and incorporates renewable energy into the chemicals and energy chain (and thus has a more widespread impact than only on GHG emissions), a potential reduction equivalent of 250–350 Mt a−1 can be estimated in the short- to medium-term. This amount represents about 10 % of the total reduction required globally, that is, it is comparable to the expected impact of carbon capture and storage technologies, but with additional benefit in terms of (i) fossil fuel savings; (ii) additional energy savings; (iii) accelerating the introduction of renewable energy into the chemicals and energy chain.


[1] IPCC Special Reports: Carbon Dioxide Capture and Storage (Eds.: B.Metz, O. Davidson, H. de Coninck, M. Loos, L. Meyer), Cambridge UniversityvPress, Cambrige 2006.
[2] G. Centi, S. Perathoner, Greenhouse Gases Sci. Technol. 2011, 1, 21– 35.
[3] N. Thybaud, D. Lebain, Panorama des voies de valorisation du CO2, l’Agence de L’Environnement et de La Matrise de L’Energie, ALCIMED, 2010.
[4] W. Seifritz, Nature 1990, 345, 486 –486.
[5] Roskill Information Services, 2008. See http://www.roskill.com/ reports.html.
[6] J. D. Jones, D. St. Angelo, WO200939445, 2009.
[7] D. Biello, Sci. Am., August 7, 2008. See: www.scientificamerican.com/ article.cfm?id=cement-from-carbon-dioxide.
[8] Carbon Dioxide as Chemical Feedstock (Ed.: M. Aresta), Wiley-VCH, Weinheim 2010.
[9] T. Sakakura, J.-C. Choi, H. Yasuda, Chem. Rev. 2007, 107, 2365 –2387.
[10] A. Decortes, A. M. Castilla, A. W. Kleij, Angew. Chem. 2010, 122, 10016 – 10032; Angew. Chem. Int. Ed. 2010, 49, 9822 –9837.
[11] Y. Zhang, S. N. Riduan, Dalton Trans. 2010, 39, 3347- 3357.
[12] G. A. Olah, A. Goeppert, G. K. Surya Prakash, Beyond Oil and Gas: The Methanol Economy, 2nd Edition, Wiley-VCH, Weinheim 2009.
[13] A. M. J. Kliphuis, L. de Winter, C. Vejrazka, D. E. Martens, M. Janssen, R. H. Wijffels, Biotechnol. Prog. 2010, 26, 687–696.
[14] Biorefineries: Adding Value to the Sustainable Utilization of Biomass, International Energy Agency, Paris 2009.
[15] L. Brennan, P. Owende, Renewable Sustainable Energy Rev. 2010, 14, 557 –577.
[16] O. Pulz, Appl. Microbiol. Biotechnol. 2001, 57, 287–293.
[17] N. T. Eriksen, Biotechnol. Lett. 2008, 30, 1525 – 1536.
[18] N. Eriksen, Appl. Microbiol. Biotechnol. 2008, 80, 1 –14.
[19] Carbon Recycling for Renewable Materials and Energy Supply – Recent Trends, Long-Term Options, and Challenges for Research and Development, Journal of Industrial Ecology 2014, Vol. 18, Issue 3, 327-340
[20] http://www.inpex.co.jp/english/csr/pdf/sustainability2014-e14.pdf


Water Treatment and Reuse with Electrocoagulation  in the Oil & Gas Industry

Author: Mauro Capocelli, Researcher, University UCBM – Rome (Italy)


1.Theme description

Electrocoagulation (EC) combines conventional treatment as coagulation and flotation with electrochemistry. The process destabilizes soluble organic pollutants and emulsified oils from aqueous media by introducing highly charged species that neutralize the electrostatic charges on particles and oil/emulsions droplets to facilitate agglomeration/coagulation (and the following separation from the aqueous phase). In comparison with conventional coagulation processes, the smallest charged particles have a greater probability of being coagulated because of the electric field that sets them in motion. Moreover, an “electrocogulated” flock tends to contain less bound water, is more shear resistant and is more readily filterable[1].

EC has been known since 1909 (Aluminium/ iron-based electrocoagulation patent by A.E. Dietrich)[2]. Is has been (most commonly) used in the oil & gas, construction, and mining industries to separate emulsified oil, petroleum hydrocarbons, suspended solids, heavy metals from effluents. Particularly in the Oil & Gas sector, the EC is fundamental to treat and reuse (on-site) the water needed for the drilling and fracking processes, minimizing the impact of injection wells. The application market has not yet exploded due to the high costs but changes in regulations and growth in the cited industrial sectors has recently brought electrocoagulation to the forefront[3].


2.Principles of Electrocoagulation

Basically, the electrocoagulation apparatus consists of a sacrificial anode, producing coagulant metal ions, and a cathode made of metal plates (both submerged in the aqueous solution). The electrodes are usually made of cheap and non-toxic metals such as aluminium and iron. The dissolution (in mass), according to the Faraday’s law, is proportional to the applied current I and the treatment time ts.

formula

Where z is the valence of ions of the electrode material, M is molar mass of the metal and F is Faraday’s constant (96485 C/mol). Coagulation is brought about by the reduction of the net surface charge; the colloidal particles (previously stabilized by electrostatic repulsion) can approach closely enough for Van Der Waals forces to aggregate. The reduction of the surface charge is a consequence of the decrease of the repulsive potential of the electrical double layer by the presence of an electrolyte having opposite charge (Fig. 1).


fig.1

Fig.  1. – Conceptual representation of the electrical double layer in colloidal particles[4]


The classical representation of EC dissolution with the induced separation mechanisms (coagulation, flocculation and flotation) is reported in Fig. 2. The following main reactions take place during EC.

tab.1

The metals and other contaminants, suspended solids and emulsified oils are entrained within the floc because of the neutralization of surface charges (destabilization). Destabilization also occurs by “sweep flocculation”, where impurities are trapped and removed in the amorphous hydroxide precipitate produced. Microbubbles (mainly of H2 and O2) adhere to agglomerates helping to separate and lift the flocs up to the surface. Depending on the application, the final solids separation step can be done using settling tanks, media filtration, ultrafiltration, and other methods.


fig.2

Fig.  2 –  Schematic representation of typical reactions during the EC treatment


Ferrous iron may be oxidized to Fe3+ by oxygen or anode oxidation and the formation of active chlorine species can enhance the performances of the EC. Both Fe and Al ions complexes with OH ions. The formation of these complexes depends strongly on the pH of the solution, as shown in Fig. 3: above pH 9, Al(OH)4− and Fe(OH)4− are the dominant species. Anions, such as sulphate or fluoride, affect the composition of hydroxides because they can participate to side reactions and replace hydroxide ions in the precipitates. Temperature affects floc formation, reaction rates and conductivity. The pollutants’ concentration affects the removal efficiency because coagulation follows pseudo second or first-order kinetics. In fact, Ezechi et al., showed a second order kinetic of boron adsorption onto Fe(OH)3 in EC. This work reported a removal efficiency of almost 97% using iron plate electrode (inter-electrode distance of 0.5 cm, 15 mg/l concentration of boron in produced water, pH 7.84, current density of 12.5 mA/cm2) .


fig.3

Fig.  3 – Concentrations of soluble monomeric hydrolysis products of Fe(III) and Al(III) at 25°C[5]


This application does not work properly in case of low conductivity (i.e. less than 300 μS/cm), low suspended solids (turbidity less than 25 NTU or TSS less than 20 mg/L), non polar and monovalent contaminates (aqueous salts of Na, K, Cl, F, etc.), non polar and charged particles.


3.Produced water treatment & reuse

The literature reports many application of EC to water treatment & reuse. Among them, the treatment of oily waste water and produced water is relevant for the Oil & Gas sector. Produced water (PW) is the water trapped in the reservoir rock subsists under high pressures and temperatures and brought up along with oil or gas during production. Other components are the salts in relation to the source (seawater and groundwater) as well as dispersed hydrocarbons, dissolved hydrocarbons, dissolved gases (such as H2S and CO2), bacteria and other organisms, and dispersed solid particles. PW may also include chemical additives (corrosion inhibitors, oxygen scavengers, scale inhibitors, as emulsion breakers and clarifiers, flocculants and solvents) used in pre-treating, in drilling and generally in producing operations as well as in the downstream oil/water separation process. These chemicals affect the oil/water partition coefficient, toxicity, bioavailability, and biodegradability.[6]

PW is considered an industrial waste and its disposal to surface waters or its evaporation in ponds is subject to stringent environmental regulations.  It should be treated and reinjected for pressure maintenance, replacing aquifer water or should be reused for irrigation or as industrial process water. Many companies propose their own EC systems (Watertectonics, F&T Water Solutions, Bosque Systems, etc.) for the treatment of PW. The conference proceedings of IDA [7] gives some interesting examples of EC pretreatment for water reuse in the Oil and Gas Industry. A thypical process scheme, taken from a pilot plant presented in the conference7, is reported in Fig. 4.

fig.4

Fig. 4 – Process scheme of a water reuse treatment plant (EC/UF/CE/RO/UV) and detail of the RO process scheme


Eames reports the case study of the Oil Field in Colombia Meta Province is provided with EC/DAF/UF/RO for the wastewater reuse (3,000 BPD of water for Agricultural Irrigation and Surface; Irrigation (<60 ppm sodium) with the characteristics in Table below. Piemonte et al. also proposed the process analysis with energy and material balances of a produced water treatment train including Vibratory Shear Enhanced Processing (VSEP) membrane system (secondary treatment) and RO destined to the tertiary treatment to achieve the quality needed for water reuse[8].

tab.2


[1] IDA
[2] Kuokkanen et al., Recent Applications of Electrocoagulation in Treatment of Water and Wastewater—A Review. Green and Sustainable Chemistry, 2013, 3, 89-121
[3] http://www.wateronline.com/doc/a-shocking-approach-to-wastewater-treatment-0001
[4] Mikko Vepsäläinen. PhD Thesis. Electrocoagulation in the treatment of industrial waters and wastewaters. VTT SCIENCE 19 JULKAISIJA – UTGIVARE – PUBLISHER (2012)
[5] Mikko Vepsäläinen. PhD Thesis. Electrocoagulation in the treatment of industrial waters and wastewaters. VTT SCIENCE 19 JULKAISIJA – UTGIVARE – PUBLISHER (2012)
[6] Gomes et al., TREATMENT OF PRODUCED WATER BY ELECTROCOAGULATION
[7] IDA (2013) Water Recycling and Desalination in the Oil & Gas Industry. Proceeds to Benefit Water-related Humanitarian Projects.
[8] Piemonte et al., Reverse osmosis membranes for treatment of produced water: a process analysis. Desalination and Water Treatment 55, 3, 2015. Reverse osmosis membranes for treatment of produced water: a process analysis


Process and Catalyst Innovations in Hydrocracking to Maximize High Quality Distillate Fuel

Author: Vincenzo Piemonte, Associate Professor, University UCBM – Rome (Italy)


1.Theme description

Worldwide economic growth continues to drive demand for transportation fuels, and in part

There are several processes presently able to meet individual refinery needs and project objectives[2]. In particular, UOP LLC Company is one of the most active society in this field[3]. The basic flow schemes considered by UOP are single-stage or two-stage design. UOP two-stage Unicracking process flow schemes can be a separate hydrotreat or a two-stage process as shown in Figure 1. In the separate hydrotreat flow scheme the first stage provides only hydrotreating while in the two-stage process the first stage provides hydrotreating and partial conversion of the feed. The second-stage provides the remaining conversion of recycled oil so that overall high conversion from the unit is achieved. These flow schemes offer several advantages in processing heavier and highly contaminated feeds. Two-stage flow schemes are economical when the throughput of the unit is relatively high.

The design of hydrocracking catalyst changes depending upon the type of flow scheme employed. The hydrocracking catalyst needs to function within the reaction environment and severity created by the flow scheme that is chosen.


2.Enhanced Hydrocracking Processes

During the early years of hydrocracking, refiners were mainly interested in maximizing production of naphtha for reforming to high octane gasoline. However with advancements in hydrocracking catalyst technology, and the demand for maximizing distillate yields from heavier feedstocks, two-stage design offers a cost-effective option for a larger capacity maximum distillate unit operation.

A major difference between the first and second stage hydrocracking reactor reaction environments lies in the very low concentrations of ammonia and hydrogen sulfide in the second-stage (see figure 2). The first-stage reaction environment is rich in both ammonia and hydrogen sulfide generated by hydrodenitrogenation and hydrodesulfurization of the feed. This significantly impacts reaction rates, particularly cracking reaction rates, leading to different product selectivity and catalyst activity between the two-stages. The catalyst system can be optimized to obtain a highly distillate selective overall yield structure. Optimum severity can be set for each stage to achieve catalyst life target with minimum catalyst volume. Overall, the two-stage design allows optimization of conversion severity between the two stages, maximizing overall distillate selectivity. New advances in the two-stage Unicracking process design include several innovations in each reaction section of the design. The pretreating section uses a high activity pretreating catalyst that allows hydrotreating at a higher severity, providing good quality feed for the first-stage hydrocracking section and enabling maximum first-stage selectivity to high quality distillate. The second-stage is optimized by use of second-stage hydrocracking catalyst that is specifically designed to take advantage of the cleaner reaction environment. The second-stage catalyst is designed so that the cracking and metal functions are balanced. At the same time the second-stage hydrocracking severity is optimized so that maximum distillate selectivity is obtained from the second-stage of hydrocracking.


fig.01

Figure 1 – Two-stage Unicracking Process Flow Schemes.
fig.02
Figure 2 – Two-stage Unicracking Process Flow Schemes.


3.Catalyst Development

Designing catalysts which can be successfully used for processing heavy feeds requires an understanding of the interactions of many factors. Detailed knowledge is increasingly important for controlling reaction pathways to achieve specific product types to meet today’s market demands. The key considerations for optimal catalyst design require good understanding of the molecular transformations of feed to product with respect to catalyst functions and process variables.

Such consideration involves process severity and its impact on the extent of secondary cracking in the hydrocracking reactor. The key steps in the mechanism of hydrocracking paraffins consists of a sequence of steps beginning with dehydrogenation at metal sites to form olefinic intermediates which are then protonated at the acid sites to form the reactive carbenium ions. These, in turn, can isomerize and leave the catalyst surface without cracking after picking up a hydride ion at the metal sites. Alternatively, they can crack to form smaller alkanes which then leave the catalyst surface as hydrocracked products[4]. This process of isomerization and cracking to primary cracked products is referred to as “ideal cracking” and therefore it does not involve secondary cracking of the initially formed product. Secondary cracking often results in the formation of light ends which are of low value to a unit operating to make liquid transportation fuels.

Control of this sequence of steps to stop the reactions after formation of primary products is accomplished by careful selection of catalyst properties such as the strength and distribution of acid sites and tailoring the hydrogenation function to fit the acidity on the catalyst. In addition, particularly when heavy feedstocks are being processed, elimination of diffusion constraints which contribute to secondary cracking is accomplished by strict control of pore size and pore geometry of the catalyst to match the molecular dimensions of a given feed. These catalyst properties must also be matched to the service environment in which the catalyst is intended to function, including the recycle gas composition and the reactor pressure. Thus, detailed knowledge of molecular types and size in the feed is incorporated into catalyst selection criteria in order to make critical determination of the appropriate catalytic components to match feed for a given unit.

fig.3

Figure 3 – Second-Stage Unicracking Catalyst Design

Hydrocracking catalysts are typically dual function catalysts, containing an acid-function for  cracking and a metal-function for hydrogenation. As shown in Figure 3, a good hydrocracking catalyst, amorphous or zeolitic, is designed to balance these two functions for optimum performance. In the figure two arrows indicate the type of functions (acid and metal) and the height of the arrows indicates the strength of the individual functions. A catalyst with proper balance of these two functions performs optimally in terms of desired product selectivity and catalyst temperature activity/stability. However if a catalyst, designed for the first-stage sour reaction environment typical of first-stage operation, is put in the cleaner reaction environment of the second-stage, a significant boost in the cracking function is observed while the performance of the metal-function remains basically unchanged. Thus, the catalyst that was in good balance for the first-stage environment becomes unbalanced for the second-stage environment resulting in sub-optimal performance. This difference is exacerbated, as the temperature required to achieve desired conversion is reduced. On the other hand the reduction in temperature reduces the metal functionality thus reducing hydrogenation. Therefore, for ideal second-stage catalyst, it is desired that the acidity of the cracking material is weak with a stronger metal-function so that even though the catalyst may appear imbalanced for the first stage sour environment it will be in balance in the second-stage reaction environment. Applying this design approach, UOP recently developed a new second-stage catalyst achieving higher distillate selectivity than the current UOP standard design.

Enhanced two-stage performance is achieved by optimized first- and second-stage conversion severity and application of the new second-stage catalyst. This results in significantly improved overall C5+ yields and a product slate which is more selective to a high quality heavy diesel product.

The enhanced two-stage design has improved distillate selectivity and the product slate is diesel selective with lower light-end production resulting in 7-10% lower hydrogen consumption. The product qualities are similar or better. The improved performance is achieved by optimum processing severity and use of new second-stage hydrocracking catalyst.


[1] Purvin & Gertz Inc., “Global Petroleum Market Outlook: Prices And Margins”, Fourth Quarter 2007 Update
[2] Thakkar V. P. et al, “Innovative Hydrocracking Applications For Conversion of Heavy Feedstocks”, AM-07-47 NPRA 2007 Annual Meeting
[3] Remsberg, Charles and Higdon, Hal, “Ideas for Rent The UOP Story”, p. 326, 1994
[4] Coonradt, H. L. and Garwood, W.E., Mechanism of Hydrocracking Reactions of Paraffins and Olefins, Ind. Eng. Chem. Process Des. Dev., 3 (1964) 38


Waste to Fuel Technologies

Author: Mauro Capocelli, Researcher, University UCBM – Rome (Italy)


1.Theme description

The growing concerns about climate change as well as the management of ever increasing liquid and solid wasters highly pushed the R&D in waste-to-fuel conversion[1]. The transformation of wastes into fuels can be realized by the different processes represented in Fig. 1 (extending the classification of 2nd generation of biofuels). The direct incineration of waste enables the highest recovery of the energy content from the thermodynamic point of view. On the other hand, depending on the composition, the emissions of the combustion process can be characterized by the presence of pollutants such as HCl, HF, NOx, SO2, VOCs, PCDD/F, PCBs and heavy metals[2].

fig.1
Fig. 1 –  Waste-to-Fuel Conversion technologies


Besides incineration, other thermochemical processes (see Fig.1) such as pyrolysis, gasification and plasma-based technologies, have been developed to selected waste streams. In general, thermal treatments of biomasses (and wastes) allow to get a wide spectrum of fuels (gaseous, liquid and solid) and many chemicals as co-product; the specific treatment is chosen according to the final fuel & chemicals products[3]. Many companies are using municipal solid waste (MSW) thermochemical conversion methods: Hitachi Metals Environmental Systems, Ebara/Alstom, Enerkem, Foster Wheeler, Nippon Steel, PKA, SVZ, etc. The first industrial-scale MSW to biofuel facility opened in Edmonton on 2014 by Enerkem converts 100000 t/year of municipal waste into chemicals and biofuels and is able to divert 90% of the residential waste from landfills[4].

The multiple synthetic conversion routes of major biofuels produced (Biofuel Flow) from first and second-generation biomass feedstock is represented in Fig 2. Conversion through biochemical and physiochemical processes is playing and important role in the recent biorefineries. These, following the  paradigm of zero-waste and zero-emission, allow the extraction of valuable substances processing biomass into a spectrum of marketable products and energy and are expected to play a fundamental role in the future low carbon economy[5]. Moreover, biorefineries would be very attractive from an employment creation perspective, resulting in significantly more jobs per unit of biomass feedstock than conventional processes[6]. A brief review of the processes and technologies cited in Fig. 1 is given in the following.


fig.2

Fig.  2 – Biofuel flow[7]


2.Thermochemical conversion

The pyrolysis occurs without oxygen at atmospheric pressures in a temperature range of 250-900°C. Generally, high vapour residence time favours char production (at lower process temperature) and gas yield (higher temperatures), whereas moderate and short vapour residence times favour the liquid production. In fast pyrolysis, the heating occurs at a moderate temperature (400-550 °C) with very high heating velocities (100°C/s). A successive rapid quenching is required to condense the vapors, to minimize secondary reactions and coalescence or agglomeration (aerosols formation). The heat duty can be recovered from the combustion of part of the produced syngas. The liquefaction by pyrolysis of solid wastes has been widely reviewed in the last years, due to the increasing interest in integrated technologies to derive fuels and chemicals from solid wastes.[8] A review on process conditions for optimum bio-oil yield in hydrothermal liquefaction of biomass is given by Akhtar and Amin[9].

Municipal plastic wastes, through the cracking and pyrolysis, can produces bio-oil of a good quality, a valid option to plastic recycling or direct combustion[10]. For example, Sharma et al. 2014 repots a study of high-density polyethylene grocery bags pyrolysis to produce alternative diesel fuels or blend components for the petroleum diesel (saturated aliphatic paraffins) of very good quality (with cetane number and lubricity). Many examples of pyrolysis plants are located in Japan. Mogami Kiko owns a Pyrolysis plant (Capacity of 200 kg/h) that produces 80-100 Nm3/h of gas with LHV of 5000-6000 kcal/Nm3 30-40 kg/h of tar and 20-30 kg/h of char, processing several kinds of plastic in a rotary kiln. Environment System have implemented the pyrolysis of thermoplastics waste (without chlorine) in a tank reactor with continuous feeding of scrap film (extruder). Toshiba implemented the continuous feeding of thermoplastics waste (no chlorine, 40 tons/day) into a rotary kiln (externally heated) producing liquid and gaseous hydrocarbons and 4MW cogeneration. Samshiro et al. described the fuel oil production from MSW in sequential pyrolysis and catalytic reforming reactors[11]. Wong et al. [12], report alternative solutions to solid waste pyrolysis as fluidized bed and supercritical water. Although microwave-assisted pyrolysis is another possible solution to the problem, especially in the treatment of commingled plastic waste, this relatively new concept requires more feasibility studies.

Gasification, operating at high temperatures (>700 °C) without combustion results into solid and gaseous products.. Although associated with lower power production and higher complexity, the gasification of solid wastes can count about a hundred of operating plants having a capacity in the range 10–250∙103 t/y and represents a valid alternative in the field of waste management[13]. Moreover, gasification-based technologies enable the reduction of waste amount to disposal in comparison to the conventional combustion-based WtE units and allows alternative strategies for the syngas utilization[14]. Therefore, gasification of waste has been exploited as alternative to combustion for the waste to energy (WtE) processes in order to improve the performances and the distributed WtE policy.

By using multiple high-temperature processes, including the breaking down of organics through plasma arcs, enables the production of a mixture of hydrogen and carbon monoxide. In this way, metals and other inorganic materials in garbage can be isolated and recycled; the combination of high temperatures and an oxygen-poor environment prevents the production of dioxins and furans; eventually the syngas can either be directly burned in gas turbines to produce electricity, or it can be converted into other fuels, including gasoline and ethanol. Enea reported several experimental campaign conducted at lab and pilot-scale devices[15]. Molino et al. investigated the steam gasification of scrap tires as a sustainable and cost-effective alternative to tire landfill disposal; steam activation of the char derived from the tire residues of the gasification process was carried out at constant temperature and feeding ratio between gasifying agent and char, using different activation times (180 and 300 min)[16].


3. Physicochemical conversion

These methods are based on the separation of useful chemical compounds with physicochemical extraction such as cold press extraction, supercritical fluid extraction, and microwave extraction.  In the recent years, cavitation assisted (e.g. ultrasound assisted) extraction process has been utilized for the biomass pretreatment, delignification and hydrolysis, extraction of oil, fermentation and synthesis of bioalcohol[17]. Transesterification of plant or algal oil is a standardized process by which triglycerides are reacted with methanol in the presence of a catalyst to deliver fatty acid methyl esters (FAME) and glycerol. The extracted vegetable oils or animal fats are esters of saturated and unsaturated monocarboxylic acids with the trihydric alcohol glyceride (triglycerides) which can react with alcohol in the presence of a catalyst, a process known as transesterification (according to the following simplified scheme of reactions).

formula

The simplified process scheme is given in Fig. 3. From an economic point of view, the production of biodiesel has proven to be very feedstock-sensitive. Leung et al., report a review on biodiesel production using catalysed transesterification[18]. Waste vegetable oil (WVO) can also be converted after refinement. It has a low sulphur content and it is not associated to change in the land use. The utilization of waste cooking oils is explained in details in the review of Kulkarni et al.[19]

fig.3

Fig.  3­ – Simplified process flow chart of alkali-catalyzed biodiesel production.


4.Biochemical conversion

 In general, the conversion of biodegradable waste or energy crops, through anaerobic digestion, produces a gaseous fuel called biogas (mainly methane and carbon dioxide). In similarity, the wastes in landfill generates gases (landfill gases, LFG) that can represent a source of renewable energy. Some examples of commercial conversion processes (typically run via anaerobic digestion or fermentation by anaerobes) are reported in the table below (extracted from).


tab

Microbial hydrogen production using anaerobic fermentative bacteria is considered a cost effective technology because the process can use waste materials or wastewaters. The biological production pathway of hydrogen and methane (by microorganisms) can be divided into two main categories: by photosynthetic bacteria under anaerobic or semi-anaerobic light conditions, and by chemotrophic anaerobic bacteria[20]. During the process, organic matter is converted to volatile fatty acids through hydrolysis and acidogenesis (acidogenic fermentation or dark fermentation). This latter produces fuel gas with higher rates. Hydrogen yields from various crop substrates is reported by Mei Guo et al.[21] Kurniawan et al. reported a study on acid fermentation combined with post-denitrification for the treatment of primary sludge[22].

Since 1980 US Department of Energy supported the Aquatic Species Program (ASP) to exploit algae as fuels (mainly oil from microalgae). The ASP firstly worked on growing algae in open ponds and on studying the the impacts of different nutrient and CO2 concentrations. The program ended in 1995 due to financial issues. In recent years, the energy security risks and the advancements in biotechnology (the ability to genetically engineer algae to produce more oils and convert solar energy more efficiently), has rebirth the R&D in this field[23]. Although the issue of low oil productivity per acre, the cultivation of oleaginous microorganisms (microalgae) can contribute to the biofuel production and to the mitigation of carbon emissions. In this files, further improvements are also needed in the downstream processes and the light supply systems.


[1] Piemonte, V., Capocelli, M., Orticello, G., Di Paola, L., 2016 Bio-oil production and upgrading in book: Membrane Technologies for Biorefining, pp.263-287
[2] Bosmans, A., et al., The crucial role of Waste-to-Energy technologies in enhanced landfill mining: a technology
review, Journal of Cleaner Production (2012), doi:10.1016/j.jclepro.2012.05.032.
Barba D, Capocelli M, Luberti M, Zizza A. Process analysis of an industrial waste-to-energy plant: theory and experiments. Process Safe Environ 2015;96:61–73.
[3] Mckendry, P., 2002. Energy Production from Biomass (Part 2): Conversion Technologies. Bioresource Technology 83, 47-54.
[4] http://cleantechnica.com/2014/06/09/first-industrial-scale-municipal-solid-waste-biofuel/
[5] Industrial Biorefineries and White Biotechnology. http://dx.doi.org/10.1016/B978-0-444-63453-5.00001-X
Copyright © 2015 Elsevier B.V.
[6] Patricia  Thornley*,  Katie  Chong,  Tony  Bridgwater.  European  biorefineries:  Implications  for  land,  trade
and  employment. Environmental Science & Policy 37  (2014) 255 –265
[7] D.King et al., The future of industrial Biorefineries. 2010 World Economic Forum.
[8] Isahak, Wan Nor Roslam Wan, Mohamed W M Hisham, Mohd Ambar Yarmo, and Taufiq Yap Yun Hin. 2012. “A Review on Bio-Oil Production from Biomass by Using Pyrolysis Method.” Renewable and Sustainable Energy Reviews 16 (8). Elsevier: 5910–23. doi:10.1016/j.rser.2012.05.039.
Bridgwater, A.V. 2012. “Review of Fast Pyrolysis of Biomass and Product Upgrading.” Biomass and Bioenergy 38: 68–94. doi:10.1016/j.biombioe.2011.01.048.
[9] Javaid Akhtar, Nor Aishah Saidina Amin. A review on process conditions for optimum bio-oil yield in hydrothermal liquefaction of biomass. Renewable and Sustainable Energy Reviews15 (2011) 1615–1624
[10] Demirbas, Ayhan. 2004. “Pyrolysis of Municipal Plastic Wastes for Recovery of Gasoline-Range Hydrocarbons.” Journal of Analytical and Applied Pyrolysis 72 (1): 97–102. doi:10.1016/j.jaap.2004.03.001.
[11] Mochamad Syamsiro et al. / Energy Procedia 47 ( 2014 ) 180 – 188
[12] S.L. Wong et al. / Renewable and Sustainable Energy Reviews 50 (2015) 1167–1180
[13] Diego Barba, Mauro Capocelli,  Giacinto Cornacchia, Domenico A. Matera. Theoretical and experimental procedure for scaling-up RDF gasifiers: The Gibbs Gradient Method. Fuel 179 (2016),60–70.
[14] Arena U, Di Gregorio F. Element partitioning in combustion- and gasificationbased waste-to-energy units. Waste Manage 2013;33:1142–50.  Arena U, Ardolino F, Di Gregorio A. Life cycle assessment of environmental performances of two combustion- and gasification-based waste-to-energy technologies. Waste Manage 2015;41:60–74.
[15] Galvagno S, Casu S, Casciaro G, Martino M, Russo A, Portofino S. Steam gasification of refuse-derived fuel (RDF): influence of process temperature on yield and product composition. Energy Fuels 2006;20:2284–8.  Portofino S, Donatelli A, Iovane P, Innella C, Civita R, Martino M, et al. Steam gasification of waste tyre: influence of process temperature on yield and product composition. Waste Manage 2013;33:672–8.  Galvagno S, Casciaro G, Casu S, Martino M, Mingazzini C, Russo A, et al. Steam gasification of tyre waste, poplar, and refuse-derived fuel: a comparative analysis. Waste Manage 2009;29:678–89
[16] Molino et al.,  Ind. Eng. Chem. Res. 2013, 52, 12154−12160
[17] Amrita Ranjan, Ultrasound-Assisted Bioalcohol Synthesis: Review and Analysis. RSC Advances A. Ranjan, S.
Singh, R. S. Malani and V. S. Moholkar, RSC Adv., 2016, DOI: 10.1039/C6RA11580B.
[18] D.Y.C. Leung et al. / Applied Energy 87 (2010) 1083–1095
[19]Waste Cooking OilsAn Economical Source for Biodiesel: A Review. Mangesh G. Kulkarni and Ajay K. Dalai*Ind. Eng. Chem. Res., Vol. 45, No. 9, 2006 Waste Cooking OilsAn Economical Source for Biodiesel: A Review
Mangesh G. Kulkarni and Ajay K. Dalai*
[20] Cheong et al., Production of Bio-Hydrogen by Mesophilic Anaerobic Fermentation in an Acid-Phase Sequencing Batch Reactor. Biotechnology and Bioengineering, 96, 2007
[21] Mei Guo et al., Hydrogen production from agricultural waste by dark fermentation: A review. International Journal of Hydrogen Energy (2010) 1-14.
[22] Kurnawian et al., Acid Fermentation Process Combined with Post Denitrification for the Treatment of Primary Sludge and Wastewater with High Strength Nitrate. Water 2016, 8, 117; doi:10.3390/w8040117
[23] http://allaboutalgae.com/history/


Waste Heat Recovery in the Oil & Gas Sector

Author: Mauro Capocelli, Researcher, University UCBM – Rome (Italy)


1.Introduction

Waste heat recovery is a process that involves capturing of heat exhausted by an existing industrial process for other heating applications, including power generation. Technavio forecasted the global waste heat recovery market in oil and gas industry to grow at a CAGR of 7.6% during the period 2014-2019[1]. The sources of waste heat mainly include discharge of hot combustion and process gases into the atmosphere (e.g. melting furnaces, cement kilns, incinerators), cooling water sand conductive, convective, and radiative losses from equipment and from heated products. To design the waste heat reclamation unit, it is necessary to characterize the stream in terms of availability, temperature, pressure and presence of contaminants such as particulate and corrosive gases. There are two main goals of recovering waste heat from industries: thermal energy recovery (both internally and outside from the plant) and electrical power generation. Fath & Hashem compared these two solution for the recovery of waste heat in an oil refinery plant located at Bagdad, Iraq[2]. For the overall energy system efficiency, it is nowadays fundamental to improve the utilization of low-temperature heat streams, primarily for thermal applications like heating, ventilation, cooling, greenhouses, etc. Oda & Hashem investigated in 1990 the selection of different strategies (air conditioning, food industry and agricultural uses) for an industrial area around including a refinery[3]. Nonetheless, also for low temperature sources, some innovations have been proposed in order to produce electricity for standalone plants and/or exploiting the resources that cannot be properly used for direct thermal applications. In the following, all these aspects are faced and some from the most recent and interest development in the R&D are reported.


fig1

Fig.1 – Estimated U.S. Energy use in 2012.


 2. Thermal energy

Electrical EnergyTraditionally, waste heat of low temperature range (0-120 °C) cannot profitably implemented for electricity generation because of the low Carnot efficiency (typically ending up with 5-7% net electricity). In the field of thermal energy direct utilization, two main options are available: waste heat recycling within the process (Fig. 2) or recovering within the plant or industrial complex.

fig2

Fig 2 – Rotary regenerator on a Melting Furnace

The main utilizations in the industrial systems are the preheating of combustion air and load or the steam generation. Transfer to liquid or gaseous process streams is also common in petroleum refineries where the operation (distillation, thermal cracking…) requires large amounts of energy that can be recovered from exothermic reactions or hot process streams in integrated systems.

Doheim et al.[4]described the integration of rotating regenerative heat exchangers in 4 refining processes (two crude distillation units, a vacuum distillation unit, and a platforming unit) in order to reduce the current losses (25 to 62% of total heat input) to the values of 9.9 to 37.3%. At the low temperature (<200° C), the best uses are the regenerative (recuperative) heating of feed-stocks (process internal reuse), district heating and LP steam generation.  District heating (or tele-heating) is a system for distributing heat generated in a centralized location for residential and commercial requirements via a network of insulated pipes (mainly or pressurized hot water and steam). In alternative, low temperature waste heat can be used for the production of bio-fuel, space heating, greenhouses and eco-industrial parks. In the industrial complexes, requiring large amount of freshwater and located near the sea, a viable alternative is that of desalinate seawater via thermal processes as Multiple Effect Distillation and Multi Stage Flash Desalination in order to obtain demineralized, potable or process water.

The generation of electricity from thermal energy should be taken into account if there are not viable options of in house utilization of additional process heat or neighbouring plants’ demand. The most commonly system involves the steam generation in a waste heat boiler linked to a steam turbine in a Rankine Cycle (RC). Industrial examples can be easily found in the literature. Steam Energy WHP from Petroleum Coke Plant, located at Port Arthur (Texas), recovers energy from three petroleum-coke calcining kilnsat temperature higher thant 500°C for producing LP steam (to use at an adjacent refinery) and 5 MW of power(saving  an estimated amount of 159,000 tons per year of CO2 emission).

Since the thermal efficiency of the conventional steam power generation becomes considerably low and uneconomical when steam temperature drops below 370 ˚C, the Organic Rankine Cycle (ORC) utilize a suitable organic fluid, characterized by higher molecular mass, a lower heat of vaporization and lower critical temperature than water[5] (silicon oil, propane, haloalkanes, isopentane, iso­butane, p­xylene, toluene, etc.).

fig3

Fig. 3.- T-s diagram of a ciclo- pentane ORC cycle


These enable the utilization of lower temperatures (if compared to the RC) and a “better”coupling (lower entropy generation) with the heat source fluid to be cooled[6]. The higher molecular mass enables compact designs, higher mass flow and higher turbine efficiencies (as high as 80­85%). However, since the cycle works at lower temperatures, the overall efficiency is only around 10­20%. As abovementioned, it is important to remember that low temperature cycles are inherently less efficient than high­temperature cycles. Jung et al., 2014, reported a techno-economical evaluation of an ORC cycle (with pure refrigerant and mixtures of R123, R134a, R245fa, isobutane, butane, pentane) to recover the heat from a liquid kerosene to be cooled down to control the vacuum distillation temperature[7]. An example of a recent successful ORC installation is at a cement plant in Bavaria (Germany) to recover waste heat from its clinker cooler (exhaust gas @ 500°C) providing the 12% of the plant’s electricity requirements and reducing the CO2 emissions by approximately 7000 tons/year. Several R&D projects[8]and commercial plants[9]are reported in the references (footnotes).An example of T-s diagram of an ORC with Cyclo-Pentane (MW 70, boiling point 49,5°C) developed by GE[10]is showed in Figure 3.Also, ElectraTherm applies proprietary ORC to generate power from low temperature heat by utilizing, as fuel in industrial boilers, the natural gas that would otherwise be flared[11].

The Kalina cycle(KC)utilizes a mixture of ammonia and water as the working fluid (with a variable temperature during evaporation). It was invented in the 1980s and the first power plant (6.5 MW, 115 bara, 515 ºC )was constructed in California (1992) and followed by many plants in Japan, Pakistan and Dubai.[12]The KC allows a better thermal matching with the waste heat source and with the cooling medium in the condenser achieving higher energy efficiency.Although the Kalina systems have the highest theoretical efficiencies, their complexity still makes them generally suitable for large power systems of several megawatts or greater.

fig.4

Fig. 4. – H-T energy recovery in the Kalina Cycle11

In addition to these cycles, some advanced technologies in the research and development stage can generate electricity directly from heat. These technologies include the Stirling engine[13], thermoelectric, piezoelectric, thermionic, and thermo-photovoltaic (thermo-PV) devices. Although they could in the future provide additional options for carbon-free power generation, nowadays show very low efficiencies. Keeping in mind that a Carnot engine operating with a heat source at 150ºCand rejecting it at 25ºC is only about 30% efficient, all these system shows global efficiencies in the range 1-10%.As an example, in the piezoelectric power generation(PEPG), a thin-film membrane is used to create electricity from mechanical vibrations from a gas expansion/compression cycle fed by waste heat (150-200°C). The temperature change (across a semiconductor),inducing a voltage (through a phenomenon known as the Seebeck effect), is implemented in the Thermoelectric generation(TEG)[14].Öström and Karthäuser recently claimed a method for the conversion of low temperature heat to electricity and cooling,comprising COabsorption and an expansion machine[15].

Finally, recent R&D efforts in the use of saline solutions at different concentrations enabled the heat conversion into electricity in the lowest temperature range of application. This is possible by making use of heat engine based on Salinity Gradient Energy(SGE) (or Salinity Gradient Power, SGP) technologies.

Salinity Gradient energy is a novel non-conventional renewable energy related to the mixing of solutions with different salinity levels, as occurs in nature when a river discharges into the sea. Clearly,when this mixing process spontaneously occurs, the associated energy is completely dissipated during the process. Conversely,this energy can be harvested by adopting a suitable device devoted to perform a ”controlled mixing” of the two streams at different salinity (e.g. river water and seawater).Depending on the device type, different technologies have been proposed so far: the Chemical Engineering Research group of the University of Palermo, involved in this field of R&D activities[16], recently edited a book[17] where Pressure Retarded Osmosis (PRO), Reverse Electrodialysis (RED) and Accumulator mixing (AccMix) are indicated as the most promising technologies.

When employed within a closed loop,each SGP technology can be used to convert waste heat into electricity. This concept is named Salinity Gradient Power Heat Engine (SGPHE) (Figure 5) and consists of two main units:

  1. the SGP unit devoted to mixing two solutions at different salt concentration in order to convert the Gibbs free energy of the relevant salinity gradient into valuable power;
  2. a regeneration unit which employs unworthy waste heat at very low energy levels (i.e. 50-100°C) to separate again the two streams thus restoring the initial salinity gradient and closing the cycle.


 fig5
Fig. 5 – Scheme of a SGP Heat Engine

The adoption of the closed loop opens room to a large variety of advantages and possibilities with respect to open-loop SGP technologies. Just as an example, the closed loop does not require the need of natural/artificial basins of solutions at different salt concentration in the same area. More important, no pre-treatments are necessary and any kind of solute or solvent can be employed with the aim of maximizing the power production and the cycle efficiency. In this regard, according to recent estimates, it appears that SGPHE (i) can be operated at very low temperatures where no alternative technologies exist and (ii) can potentially achieve exergetic efficiencies higher than any other technology[18].


[1] Global Waste Heat Recovery Market in oil and Gas Industry 2015-2019 by Infiniti Research Limited (2015).
[2]H.E.S. Fath, H.H. Hashem. Waste heat recovery of dura (Iraq) oil refinery and alternative cogeneration energy plant. Heat Recovery Systems and CHP 8, Issue 3, 1988, 265-270
[3]Oda & Hashem, 1990. Proposals for utilizing the waste heat from an oil refinery. Heat Recovery Systems and CHP, 10, Issue 1, 1990, Pages 71-77
[4]M.A. Doheim †, S.A. Sayed, O.A. Hamed. Energy analysis and waste heat recovery in a refinery. Energy
Volume 11, Issue 7, July 1986, Pages 691-696
[5]Bahram Saadatfar, Reza Fakhrai and TorstenFransson, JMES Vol 1 Issue 1 2013
[6]J. Larjola/lnt. J. Production Economics 41 (1995) 227-235
[7] H.C. Junga, Susan Krumdiecka, , , Tony Vranjes Feasibility assessment of refinery waste heat-to-power conversion using an organic Rankine cycle. Energy Conversion and Management. Volume 77, January 2014, Pages 396–407
[8]http://www.lttt.uni-bayreuth.de/en/projects/Fachgruppe-ESuT/
[9]http://www.ormat.com/organic-rankine-cycle
http://www.atlascopco-gap.com/fileadmin/download/brochure/AC-ORC-BRO.pdf
http://www.alfalaval.com/waste-heat-recovery/profiting-on-waste-heat/
[10] Development and Applications of ORegen Waste Heat Recovery Cycle. Development and Applications of ORegen Waste Heat Recovery Cycle
Andrea Burrato
© 2015 General Electric Company. All rights reserved
[11]https://electratherm.com/electratherms-waste-heat-to-power-technology-reduces-flaring-at-oil-well/
[12]http://www.heatispower.org/wp-content/uploads/2013/11/Recurrent-Eng-macwan_chp-whp2013.pdf
http://www.globalcement.com/magazine/articles/721-kalina-cycle-power-systems-in-waste-heat-recovery-applications.
[13] A.V. Mehta, R.K. Gohil ,J.P. Bavarv, B.J. Saradava. Waste heat recovery using Stirling Engine. IJAET/Vol.III/ Issue I/ 2012/305-310
[14]https://www.alphabetenergy.com/how-thermoelectrics-work/
[15]US 20130038055 A1Method for conversion of low temperature heat to electricity and cooling, and system
[16]L. Gurreri et al., 2014. CFD prediction of concentration polarization phenomena in spacer-filled channels for reverse electrodialysis. Journal of Membrane Science, 2014, vol. 468, pag. 133-148.
  1. Tedesco et al., 2015. A simulation tool for analysis and design of reverse electrodialysisusing concentrated brines. Chem. Eng. Res. Des. 93, 441–456M.
  2. Tedesco et al., 2016. Performance of the first Reverse Electrodialysis pilot plant for power production from saline waters and concentrated brines. Journal of Membrane Science, 2016, 500, 33-45.
  3. Bevacqua et al., 2016.Performance of a RED system with Ammonium Hydrogen Carbonate solutions. Desalination and Water Treatment, in press. doi: 10.1080/19443994.2015.1126410
[17]A. Cipollina, G. Micale, Sustainable Energy from Salinity Gradients, 1st ed., Woodhead Publishing – Elsevier, 2016, isbn-9780081003121
[18]A. Tamburini, A. Cipollina, M. Papapetrou, A. Piacentino, G. Micale, Salinity gradient engines, Chapter 7 in: Sustainable Energy from Salinity Gradients, 1st ed., Woodhead Publishing – Elsevier, 2016, isbn-9780081003121


In-Situ Remediation of Soil, Sediments, and Groundwater Contaminated by Hazardous Substances

Author: Mauro Capocelli, Researcher, University UCBM – Rome (Italy)


1.Theme description


Highly polluted sites are present all over the world and particularly in countries that, in the last years, have seen uncontrolled and unplanned economic development. They are the result of earlier industrializationand poor environmental management practices that caused the alteration of groundwater and surface water, air quality, the hampering soil functions, and the polluting in general. In Europe there are about 500000 contaminated sites and two million of potentially contaminated sites. These are often made from the retired industrial, extractive and military activities[1].The U.S. Department of Energy (DOE) manages an inventory of sites including 6.5 trillion liters of contaminated groundwater (equal to about four times the daily U.S. water consumption) and 40 million cubic meters of soil and debris contaminated with radionuclides, metals, and organics. Some of the main contamination sources in this field are depicted in Figure 1[2].

Remediation represents the set of solutions such as the treatment, the containment or the removal/degradation of chemical substances or wastes so that they no longer represent an actual or potential risk to human health or the environment, taking into account the current and intended use of the site[3]. As described by EPA, any Remediation management plan considers complex systems involving different pollutants and polluted matrix and should include all the impacted environmental aspects such as air quality, noise, surface water, soil quality, ground water management, floraand fauna, heritage as well as social, structural and safer aspect. The dispersion of the Non Aqueous liquid phase (NAPL) in Figure 1 depends on the site geotechnical characteristics, the aquifer relative positions and the pollutant chemical properties. Sometimes the contamination sources succeeds in reaching the groundwater pollution, such as at solid waste landfills where chlorinated organic compounds reach the groundwater due to rainfall water leaching.

fig.1

Figure 1 – Site contamination sources and mechanisms of dispersion


2.Techniques and technologies

Typical pollutants in this sector are aromatic hydrocarbons, heavy metals, pesticides as well as biological contaminants. The choice of a contaminated soil remediation technology is based oneconomic factors, the site-specific characteristics and of the remediation goal.Remediation technologies can be realized both on-site and off-site and act mainlyby Transformation (degradation of complex organic compounds to simpler intermediate, possibly up to the full mineralization) and removal from the contaminated matrix, typically for heavy metals, already in elemental form, which cannotbe further degraded. When these techniques cannot be accomplished or are too risky and expensive, immobilizationordinary Portland cement (OPC), water glass (sodium silicate), gypsum or organic polymers, for example acrylic or epoxy resins, covering with bentonite or polymeric membrane are the available options to ensure the isolation of the polluted site to reduce the water infiltration and the possible mobilization and migration of the elements.In this brief review, it is complicated to clearly distinguish the methods according to the contaminated matrix (being a phenomenon often multi-matrix&multi-pollutant) and to the possibility of realizing them close to the site or far away in centralized systems.Therefore, thetreatment are presented in relation to the technological nature of the process (physical-chemical, thermic and biological), as listed in Table 1.

 tab1

 Table 1 – Remediation Processes


Due to the recalcitrant nature or the toxicity of the main pollutants,incompatible with biological systems, it is necessary to implement chemical methods to neutralize these substances: to convert into less harmful forms, less mobile, more stable and inert) the substances.Injection of chemical reductants, including calcium polysulphide, has been used to promote contaminant reduction and precipitation within aquifers. TheIn-situ Oxidation consists in injecting oxidants such as hydrogen peroxide (H2O2) into the contaminated aquifer.

fig.2

Figure 2 – In Situ Oxidation of polluted groundwater


Contaminants that are well suited to remediation using this approach include metals with a lower solubility under reduced conditions (e.g. Cr (VI), through reduction to Cr(III) and precipitation of Cr(III) hydroxides). Advanced oxidation processes releasinghydroxyl radicals are the most affordable techniques to degrade organic recalcitrant pollutants. These include the use of H2O2, UV, O3, “Fenton reactants”, etc.

fig.3

Figure 3 – OH attack to the aromatic ring.


 The physical treatments mainly consist in the separation of the pollutant.Alternatively, it is possible to isolate highly concentrated matrix to be eventually treated or sent to the final disposal. This solution avoids the addition of chemical reagents (and secondary pollutant formation) but should include costs for gas treating and for landfilling, especially for special waste.The air sparging is successfully applicable to volatile compounds (hydrocarbons and chlorinated solvents).Physical and geotechnicalcharacteristic of the soil as well as chemical properties of the pollutant are fundamental in the process analysis. The aquifer characteristic, if present, also influences the process. Natural zeolite has been studied extensively for remediation of heavy metal-polluted soils due to its wide availability and low cost.

The Pump-and-treatinvolves removing contaminated groundwater from strategically placed wells, treating the extracted water after it is on the surface to remove the contaminates using mechanical, chemical, or biological methods, and discharging the treated water to the subsurface, surface, or municipal sewer system. Water from the aquifer is pumped through the wells and piped to the pump-and-treat facilities, where contaminants are removed through an ion exchange that relies on tiny resin beads, resembling cornmeal, packed into large tanks or columns. As the water travels through the columns, hexavalent chromium ions cling to the resin beads and are removed from the water.[4]

Depending on the type of the reactive material and contaminants, the degradation may be complete ormay produces intermediates with different toxicity by the initial compounds.Therefore, very often the use of chemical-physical combined techniques (e.g. soil washing)could exploit the advantages of both.

While pump and treat of groundwater mainly include ex-situ treatments, Permeable Reactive Barriers (PRBs)can be used for the in-situ treatment of the waterscontaminated ground. As visible in Figure 4, a PRB consists of a continuous treatment zone, in its usual configuration, formed by the reactive material, installed in the subsoil in order to intercept the contaminated plume and induce the degradation of the contaminants from the mobile liquid phase.This technology is energy-saving since a reactive mediumwith a permeability higher than that of the surrounding soil has to be used[5],[6]. In this way, remediation occurs under the natural gradient of the aquifer, without additional energy contribution except the groundwater hydraulic head.PRBs are defined Permeable Adsorptive Barrier (PABs) when adsorbing material is used as reactive one and contaminant removal is carriedout by adsorption6. Recently, academic research is focusing on the investigation of innovative configurations, such as Discontinuous Permeable Adsorptive Barriers[7], which is arranged as a passive well array with one or more lines at a fixed distance one another and filled with adsorbing materials (Figure 5). Comparing Continuous and Discontinuous Adsorptive Barrier configurations it can be found that the decontamination of the same volume of groundwater can be carried out by reducing the amount of the barrier volume, and consequently by reducing remediation cost,if a Discontinuous barrier is used, highlighting the technology and cost-saving innovation of this advanced configuration[8].

fig.4

Figure 4 – Schematic of aContinuous PRB


fig.5

Figure 5 – Schematic of aDiscontinuous PAB7


The biological remediation methods (BioSparging, Landfarming) are available for high permeable and homogeneous soils for the mineralization or conversion of organic contaminants (SVE, BV, BTEX, light hydrocarbons, non-chlorinated phenols) into less toxic forms, or more toxic but less bioavailable. This process primarily exploit the ability of microorganisms transform the polluting material part in the biomass and partly into less complex molecules (eventually to minerals, carbon dioxide and water). These processes have been tried to remove heavy metals from soil as well, using biological leaching (bioleaching) or redox reactions.These methods are also non-invasive and can bring potential beneficial effect on the structure and fertility of the soil.In addition to microorganisms, plants can accumulate and degrade the contaminants in the so-called phytoremediation process. This recovery method, called phytoremediation, takes advantage of the complex interaction between root system of plants, microorganisms and soil, and represent the most sustainable solution in this sector. A review is given by Puldorf and Watson[9].A typical plant may accumulate about 100 parts per million (ppm) zinc and 1 ppm cadmium. Thlaspi caerulescens (alpine pennycress, a small, weedy member of the broccoli and cabbage family) can accumulate up to 30,000 ppm zinc and 1,500 ppm cadmium in its shoots, while exhibiting few or no toxicity symptoms. A normal plant can be poisoned with as little as 1,000 ppm of zinc or 20 to 50 ppm of cadmium in its shoots[10]. Phytoremediation has also been studied for degrading PCBs and PCDD/Fs [11].Some disposal methods for phytoremediation crops were proposed by Sas-Nowosielska et al.[12].The most beneficiary is to use phytoextraction crops for energy production hence pyrolysis, gasification or combustion. The fate of trace elements during combustion, pyrolysis, fluidized bed and downdraft gasification were studied in the recent scientific literature[13].

TheThermal methodscan induce the separation of the pollutant meansdesorption / volatilization and its destruction or immobilization by fusion of the solid matrix. In the desorption of pollutants from contaminated soil, a major research effort has been initiated to characterize the rate-controlling processes associated with the evolution of hazardous materials from soils[14]. The P.O.N. Research Project DI.MO.D.I.[15] was focused on the treatment of soils contaminated by hydrocarbons by an innovative device that could represent the solution to many logistical problems that make difficult the “on-site” treatment. The device (sketched in Figure 6) developed consists ina mobile unit, installed on truck, completely self-sufficient, able to permit emergency safety and remediation in reasonable short times and low cost actions. The treatment unit utilizes a dual fluidized bed reactortechnology fed by the hot gas produced by a hot gas generator. The upper bed is aimed at soil drying while the lower bed is aimed at soil remediation by thermal desorption. The processes of soil draying anddesorption of volatile and semi-volatile organic contaminantsoccur by the direct contact air/solid particles promoted by the fluidization technology. The soil requires a pre-treatment based on shredding/pulverizing and dimension separation, in order to feed the soil with the optimal size for fluidization. Particle removal from desorption gaseous flow stream is carried out by dust separator units (fabric filter and cyclone).

fig.6

Figure 6 – Schematization of the DI.MO.D.I.treatment unit


fig.7

Figure 7 – DI.M.O.D.I.treatment unit


[1]http://www.scientificamerican.com/article/10-most-polluted-places-in-the-world1/
W.W. Kovalick, Jr. Robert H. Montgomery.. Developing a Program forContaminated Site Management inLow and Middle IncomeCountries The World Bank
Ahmad I., Hayat S. and Pichtel J.(2005). Heavy Metal Contamination of Soil: Problems and Remedies. SciencePublishers, Inc. Enfield, NH, USA
Van Lynden, G.W.J. (1995). European soil resources. Current status of soil degradation, causes, impacts and need for action. Council of Europe Press. Nature and Environment, No 71, Strasbourg, France.
[2] http://energy.gov/em/services/site-facility-restoration/soil-groundwater-remediation
[3]EPA Guidelines for Environmental management of on-site remediation
[4] http://energy.gov/em/articles/pump-and-treat-systems-prove-effective-deliver-cost-savings-groundwater-cleanup
[5]U.S. EPA, 1999. Field Applications of In Situ Remediation Technologies: Permeable Reactive Barriers, EPA, 542-R-99-002.
[6]Erto, A., Lancia A., Bortone I., Di Nardo A., Di Natale, M., Musmarra D., 2011. A procedure to design a Permeable Adsorptive Barrier (PAB) for contaminated groundwater remediation. Journal of Environmental Management, 92, 23-30.
[7] Bortone, I., Di Nardo, A., Di Natale, M., Erto, A., Musmarra, D., Santonastaso, G.F., 2013. Remediation of an aquifer polluted with dissolved tetrachloroethylene by an array of wells filled with activated carbon. Journal of Hazardous Materials, 260, 914–920.
[8] Santonastaso, G. F., Bortone, I., Chianese, S., Erto, A., Di Nardo, A., Di Natale, M., Musmarra, D., 2015. Application of a discontinuous permeable adsorptive barrier for aquifer remediation. A comparison with a continuous adsorptive barrier. Desalination and Water Treatment, doi: 10.1080/19443994.2015.1130921.
[9] Review article Phytoremediation of heavy metal-contaminated land by trees—a review I.D. Pulford*, C. Watson. Environment International 29 (2003) 529 – 540
[10]From US Department of Agriculture Phytoremediation: Using Plants To Clean Up Soils
[11] Campanella, Bock, C., Schroder, P., Phytoremediation: PCBs And PCDD/Fs Environmental Science and Pollution Research January 2002, Vol 9, Issue 1, pp 73-85
[12] A Sas-Nowosielska et al., Environmental PollutionVol. 128, Issue 3, 2004, 373-379.
[13] M. Šyc, M. Pohořelý, M.  Jeremiáš, M. Vosecký, P. Kameníková, S. Skoblia, K. Svoboda and M. Punčochář. Behavior of Heavy Metals in Steam Fluidized Bed Gasification of Contaminated Biomass. Energy Fuels, 2011, 25 (5), 2284–2291.M. Šyc et al., Willow trees from heavy metals phytoextraction as energy crops. Biomass and BioenergyVol. 37, 2012, 106–113. P. Vervaeke et al., Fate of heavy metals during fixed bed downdraft gasification of willow wood harvested from contaminated sites. Biomass and Bioenergy. Volume 30, Issue 1, 2006, 58–65.
[14] JoAnn S. Lighty,” Geoffrey D. Silcox, and David W. Pershing. Vic A. Cundy David G. Linz   Fundamentals for the Thermal Remediation of Contaminated Soils. Particle and Bed Desorption Models Environ. Sci. Technol. 1990, 24, 750-757. Marline T. Smith, M.T., Franco Berruti,and Anil K. Mehrotra. Thermal Desorption Treatment of Contaminated Soils in a NovelBatch Thermal Reactor Ind. Eng. Chem. Res.2001,40,5421-5430.
[15] Piano Operativo Nazionale Ricerca e Competitività 2007-2013, PON01_00599 “Dispositivo Mobile per Desorbimento Idrocarburi (DI.MO.D.I.)” – Consortium leader: Second University of Naples (Scientific Coordinator and Principal Investigator: Prof. Dino Musmarra)