Applications of robotic technologies in the upstream and downstream sector

Author: Giovanni Franchi-Chemical Engineer – PhD Student –University UCBM – Rome (Italy)


  1. Theme Description

According to the 2017 edition of the BP Energy Outlook the world economy will double over the next 20 years with an annual growth of 3,4% drive by China and India. Oil, gas and carbon will account for more than 75% of energy supplies in 2035, despite of the use of renewable resources will increase. In this context gas will overtake coal becoming the second fuels source in 2035 with an annual growth of 1,6 %.[1]Focus on oil demand, it reached 94,4 Mbbl/day in 2015 and it is expected to overtake 100 Mbbl/day in 2021.[2]Therefore oil companies have started to explore new unconventional reservoirs such as tight and heavy oil, shale gas etc. with the aim to increase the production.[3] However these new oilfields are in desert, artic, deep water zones and require specific technologies to be extracted. In last fifty years several accidents occurred such as Exxon Valdez oil spill in 1989[4]or Deepwater Horizon oil spill in 2010[5].  In this scenario robotic technologies can have a key role in increasing safety, efficiency, productivity and minimize risks. Therefore, in the following sections their applications in the oil and gas sectors are described.

energy

Figure 1 – Energy Consumption from 1965 up to 2035.


[1]https://www.bp.com/content/dam/bp/pdf/energy-economics/energy-outlook-2017/bp-energy-outlook-2017.pdf
[2]https://www.iea.org/publications/freepublications/publication/MTOMR2016.pdf
[3]http://www.unconventionalenergyresources.com/
[4]https://www.britannica.com/event/Exxon-Valdez-oil-spill
[5]https://www.britannica.com/event/Deepwater-Horizon-oil-spill-of-2010


To see more go to full text article FIG PDF


The Contribute of Digital Technologies for the Oil and Gas Industry

Author: Giovanni Franchi-Chemical Engineer – PhD Student –University UCBM – Rome (Italy)


1. Theme Description

The IEA estimated, in the“Medium-Term Oil Market Report 2016”, that oil demand will increase from 94.4Mbbl/day in 2015 up to 101.6 Mbbl/day in 2021 with a mean annual growth of 1.2% dragged by Asia and Middle East.[1]However, in last ten years the cost of productions have increased by about 60%, while oil prices fell down.[2] For example, referring to OPEC oil prices decreased from 109.45 US$/bbl in 2012 to 40.68 US$/bblin 2016.[3] In this scenario digital technologies can have a pivotal role in reducing costs and risks, increase production and efficient of operations. McKinsey&Company, indeed, argued that digital technologies could reduce capital expenditures of about 20%, operating costs of 3-5% in upstream and of about 50% in downstream.[4]Moreover, digitalization could create, in the next ten years, about 1trillion dollars for the sector of which 580-600 billion for upstream, 100 billion for midstream and 260-275 billion for downstream. Furthermore, it could improve productivity by about 10 billion dollars, reduce water usage and emissions by 30 and 430 billion dollars respectively and save 170 billion dollars for customers.[5] Therefore in the following sections, the main digital technologies and the digital oilfield are described.


[1]https://www.iea.org/publications/freepublications/publication/MTOMR2016.pdf
[2] H. Hassani, The role of innovation and technology in sustaining the petroleum and petrochemical industry, Technological Forecasting and Social Change, 2017, 119, pp. 1-17.
[3] https://www.statista.com/statistics/262858/change-in-opec-crude-oil-prices-since-1960/
[4] https://www.mckinsey.com/industries/oil-and-gas/our-insights/the-next-frontier-for-digital-technologies-in-oil-and-gas#0
[5] http://reports.weforum.org/digital-transformation/wp-content/blogs.dir/94/mp/files/pages/files/dti-oil-and-gas-industry-white-paper.pdf


To see more go to full text article FIG PDF


Hydrocracking: converting Vacuum Residue in Naphtha and Diesel

Authors:
Marcello De Falco – Associate Professor – University “Campus Bio-Medico” of Rome.
Mauro Capocelli – Researcher – University “Campus Bio-Medico” of Rome.


  1. Theme description

In the refinery sector, both the fuel and the feedstock market as well as the more stringent environmental regulations are exacerbating the need of maximizing the residue conversion to distillates. In particular, while the distillate fuel demand (gasoline, diesel) is still increasing, the demand of residue fuel oils is about to fall sharply.

Compared with traditional technologies, the present refineries face several challenges because of the presence of crude oils characterized by high content of aromatics, acids, metals and nitrogen, therefore putting more pressure on the hydrocracking and hydrotreating processes that have to handle a low quality feedstock without significant loss of yield or efficiency[1].

The Hydrocracking (HC) process is able to remove the undesirable aromatic compounds from petroleum stocks producing cleaner fuels and more effective lubricants. In other words, the main application is to upgrade vacuum gas oil alone or blended with other feedstocks (light-cycle oil, deasphalted oil, visbreaker of coker-gas oil) producing intermediate distillates (naphta, jet and diesel fuels), low-sulfur oil and extra-quality FCC feed. HC works by the addition of hydrogen and by promoting the cracking of the heavy fractions in lighter products. With reference to Figure 1, HC globally involves the catalytic cracking (end other micsplitting of a C-C bond) and the addition of hydrogen to the C = C bond (exothermic).

Reactions of cracking and hydrogen addition during hydrocracking

Figure 1: Reactions of cracking and hydrogen addition during hydrocracking


[1]Shell Global SolutionsNEXT-LEVEL HYDROCRACKER FLEXIBILITY UNLOCKING HIGH PERFORMANCE IN TODAY’S TURBULENT MARKETS. www.shell.com/globalsolutions


To see more go to full text article FIG PDF


Producing Catalyst such as Methanol Synthesis Catalyst, Ziegler Natta Catalyst, Ammonia Catalyst

Author: Marcello De Falco, Associate Professor, University UCBM – Rome (Italy)


1.Theme Description

Catalysts are substances used to speed-up chemical reactions or to selectively drive the desired reaction to promote maximum efficiency. They can be homogeneous or heterogeneous, that is they can be in the same aggregation state of one or more reagents or not. Focusing  the attention on heterogeneous solid state catalysts, which are largely the most applied, they are generally shaped bodies of various forms, as rings (being Rashig rings the most diffused, refer to Figure 1), spheres, tablets and pellets and their performance is measured according to indices as:

  • activity (rate with which a chemical reaction proceeds towards equilibrium in the presence of the catalyst);
  • selectivity (the ratio between the rate of the desired reaction to the rate of the secondary undesired reactions);
  • specific surface area per cubic meter or kilogram;
  • diffusivity which the ability to diffuse reagents and products within the catalyst structure.


Fig.1Fig. 1 – Rashig rings


To see more go to full text article FIG PDF


GTL: Small Scale and Modular Technologies for Gas to Liquid Industry

Author: Elvirosa Brancaccio – Serintel Srl – Rome (Italy)


1. Introduction

Gas-to-liquids (GTL) is a technology that enables the production of clean-burning diesel fuel, liquid petroleum gas, base oil and naphtha from natural gas. The GTL process transforms natural gas into very clean diesel fuel because products are colorless and odorless hydrocarbons with very low level of impurities.

Much of the world’s natural gas is classified as “stranded,” meaning it is located in a remote area, far from existing pipeline infrastructure. The volumes often are too small to make constructing a large-scale treatment gas plant cost-effective.  As a result, the gas is typically re-injected into the reservoir, left in the ground, or flared, which is harmful to the environment. However, the availability of this low cost, stranded gas has incentivized companies to develop innovative technologies that can economically and efficiently utilize this gas converting it into a transportation fuel like diesel and jet fuel.

Refineries can also use GTL to convert some of their gaseous hydrocarbon waste products into valuable fuel oil which can be used to generate income.

Small-scale GTL plants are containerized units comprised of a reformer for synthesis gas production, a Fischer Tropsch (FT) reactor for syncrude production, and, in some cases, an upgrading package, which is used to further refine the FT products into the desired transportable fuel.  Since these containerized units already have about 70 percent of their construction complete before reaching the plant site, on-site construction costs are significantly reduced.  In cases where capacity needs to be increased, additional units can be easily shipped via truck or ship and connected in parallel to the existing process.  Depending on the technology, capacity can range anywhere from 100 barrels per day (bpd) to 15,000 bpd.


2. GTL Process Phases

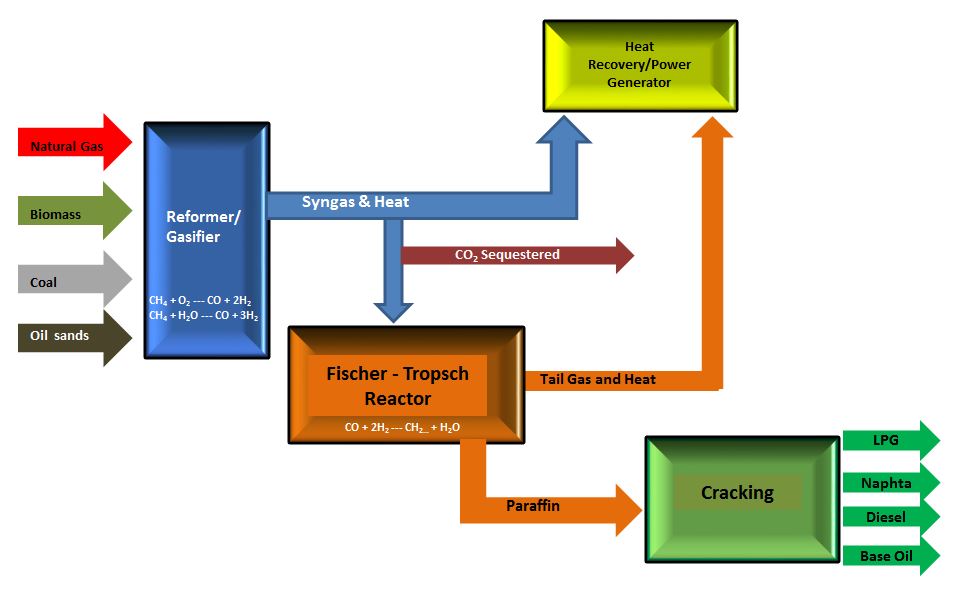
Fischer-Tropsch is the process of chemical converting natural gas into liquids (GTL), coal to liquids (CTL), biomass to liquids (BTL) or bitumen from oil sands to liquids (OTL).

All four processes consist of three technological separate sections.

  1. The production of synthesis gas (syngas).

The carbon and hydrogen are initially divided from the methane molecule and reconfigured by steam reforming and/or partial oxidation. The syngas produced, consists primarily of carbon monoxide and hydrogen.

  1. Catalytic (F-T) synthesis.

The syngas is processed in Fischer-Tropsch (F-T) reactors of various designs depending on the technology creating a wide range of paraffinic hydrocarbons product (synthetic crude, or syncrude), particularly those with long chain molecules (e.g. those with as many as 100 carbons in the molecule).

  1. Cracking – product workup.

The syncrude is refined using conventional refinery cracking processes to produce diesel, naphtha and lube oils for commercial markets. By starting with very long chain molecules the cracking processes can be adjusted to an extent in order to produce more of the products in demand by the market at any given time. In most applications it is the middle distillate diesel fuels and jet fuels that represent the highest-value bulk products with lubricants offering high-margin products for more limited volume markets. In modern plants, F-T GTL unit designs and operations tend to be modulated to achieve desired product distribution and a range of product slates.

 GTL process


Fig. 1 – GTL technological process with Fischer-Tropsch synthesis reactor

Research and development in GTL process and plant involves several part of the plant:

  • the production efficiency increment for each single unit used upstream and downstream
  • the catalyst into the FT reactor in order to increase its selectivity and durability
  • the design of the reactors to reduce the entire plant or module foot print


3. Start and Development

Synthetic fuel production technology, known as GTL, was invented in the 1920s. One of the best-known ways to create synthetic fuel is through Fischer-Tropsch (FT) synthesis. FT technology was initially developed in Germany to solve petroleum shortages leading up to World War. By 1944, Germany was producing 124 Mbpd of synthetic fuels from coal at 25 FT plants.

Next-generation technology was developed in South Africa, which sought to support its economy without oil. In the 1970s, the technology evolved in Western Europe and the US with big plant and large scale production.

Starting from the last decades, advances in GTL technologies have enabled small-scale GTL, and even micro-scale GTL, to be operationally and potentially economically feasible.

Several factors are converging to drive the growth in the GTL industry:

  1. Desire to monetize existing stranded gas reserves;
  2. Energy companies keen to gain access to new gas resources;
  3. Market demand for cleaner fuels and new cheaper chemical feedstocks;
  4. Rapid technology development by existing and new players;
  5. Increased interest from gas rich host governments

As petroleum prices remain high, new discoveries make natural gas abundant and cheap by comparison, and more advanced energy companies are exploring ways to reduce the CAPEX of synthetic fuel production. As part of this goal, companies are looking into building smaller-scale, modular plants that can operate in remote locations[1].

Several Gas-to-Liquids (GTL) technologies have emerged over the past three decades as a credible alternative for gas monetisation for gas-producing countries to expand and diversify into the transportation fuel markets. The final GTL product may be syncrude, which can be injected into an oil pipeline, thereby avoiding the need to transport another product to market, or higher-value liquid fuels or chemical feedstocks such as gasoline, diesel (without sulphur and with a high cetane number), naphtha, jet fuel, methanol or di-methyl ether (DME).


4. Plants and Projects

WORLD COMMERCIAL-SCALE GTL PLANTS

At present, five commercial-scale GTL plants are in operation (Fig. 1). These five plants include:

  • Bintulu GTL, Malaysia
  • Escravos GTL, Nigeria
  • Mossel Bay GTL, South Africa
  • Oryx GTL, Qatar
  • Pearl GTL, Qatar.

These five plants represent nearly 259 Mbpd of capacity. At 140 Mbpd, Shell’s Pearl GTL complex represents more than 50% of the world’s total commercial-scale GTL capacity.


GTL plant world


Fig. 2 – Commercial-scale GTL plants in operation around the world [2]


The first GTL plant was developed by PetroSA in 1992. This 36-Mbpd plant is in Mossel Bay, South Africa. The plant utilizes FT technology to process methane-rich natural gas into high-quality, low-sulfur synthetic fuels. Products include unleaded petrol, kerosene, diesel, propane, distillates, process oil and alcohols.

Shell commissioned its first commercial GTL plant in Bintulu, Malaysia in 1993. The plant’s initial construction cost was $850 MM. The 12.5-Mbpd plant underwent a $50-MM debottlenecking that increased total capacity to 14.7 Mbpd. Since 1993 has produced the following products: liquefied petroleum gas (up to 5%), naphtha (up to 30%), diesel fraction (up to 60%) and paraffin (up to 5-10%).


Bintulu GTL plant

Fig. 3 – Bintulu GTL  plant [3]


The Pearl GTL complex is the largest GTL facility in the world. The 140-Mbpd facility is located in Ras Laffan Industrial City, Qatar. The $19-B natural gas processing and GTL integrated complex was developed by a JV of Shell and Qatar Petroleum.

Oryx GTL was the Middle East’s first GTL plant. Developed by Qatar Petroleum and Sasol, the $6-B plant also processes natural gas from Qatar’s North Field. Construction of the facility began in late 2003, and it started production in early 2007. The facility processes 330 Mcfd of methane-rich gas from Qatar’s North field and produces 34 Mbpd of liquids, with the majority being low-sulfur, high-octane GTL diesel.

The latest commercial-scale GTL plant to commence operations is the Escravos GTL plant. The $10-B facility was developed by a JV consisting of Chevron, Sasol and Nigerian National Petroleum Corp. The plant utilizes technology from both JV partners to convert up to 325 MMcfd of natural gas into 33 Mbpd of GTL diesel and GTL naphtha. The plant has been operational since 2014.

NEW GTL FACILITIES UNDER DEVELOPMENT

The ENVIA Energy’s GTL plant on the Waste Management landfill in Oklahoma came on line in 2017. The plant, partially fed with landfill gas, announced its first finished, sale able products on June 30 2017, but at January 2018, has not yet reached the 250 bpd design capacity.

The start-up of other 4 plants (Greyrock 1, Juniper GTL, Primus 1 and Primus 2) will happen in 2018.  The new owner of Juniper GTL, York Capital, will likely target future plant sizes of more than 5000 bpd (consuming 50 MMscfd of gas). Greyrock and Primus GE announced to continue strong business development efforts in the gas flare arena.

Haldor Topsoe has joined forces with Modular Plant Solutions (MPS) and has designed and engineered a small-scale methanol plant (215 tpd) called “Methanol-To-GoTM”. The size of the plant is similar to the Primus 1 and 2 plants with a gas feed rate of 7 MMscfd.

BgtL is a new player in the micro-GTL arena (20-200 bpd). However,  their  patented  technologies  are based  on  2 decades  of  R&D  work  in  research  institutes. Their portfolio  of products includes  plant  modules  that convert  gas  volumes  as small as 2  Mscfd into  a  range  of  products  including  oil,  diesel,  methanol  and others.

Summarizing, the current leading GTL technology providers with commercial offers are:

Micro-GTL: Unattended operation units below ~1MMscfd and below ~US$ 10mln

  • Greyrock
  • GasTechno
  • BgtL

Mini-GTL: Small modular plants with some operators and a cost >US$ 10mln

  • Greyrock
  • EFT/Black and Veatch
  • INFRA
  • Primus GE
  • Topsoe/MPS
  • Expander Energy


More information on these companies and their projects can be found into the most recent bulletin on GTL technology [4].

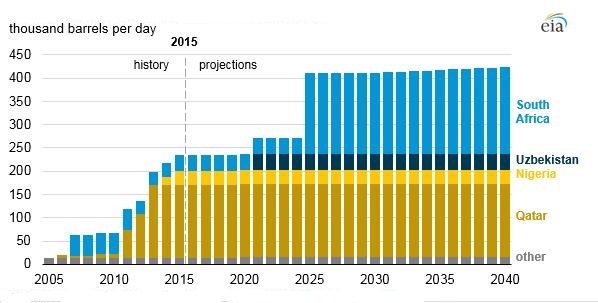
In the following figure is reported the forecast furnished by EIA for GTL production in the next few years:

futuremod

Fig. 4 – Global gas to liquid plant production, 2017 [5]


4.1  Available Technologies Overview

The GTL market is pushing toward small-scale and modular units. These types of plants can be built at greatly reduced capital cost, which can run into the billions of dollars for large-scale facilities.

Gas units, technologies used, size and other functional data for several companies involved in the GTL technology are summarized in the tables below[6]:

Calvert Energy Group/OXEON


GTL plant calvert

Fig. 5 – Calvert Energy Group GTL plant


The Calvert Energy Group offers modular GTL (Flare & Stranded Gas to Diesel plants ranging in size from 0.2 MMscf/d to 100 MMscf/d. The OEXON technology used is exclusively licensed to Calvert Energy Group by OXEON.

calvert energy group data

Tab. 1 –  Calvert Energy Group data
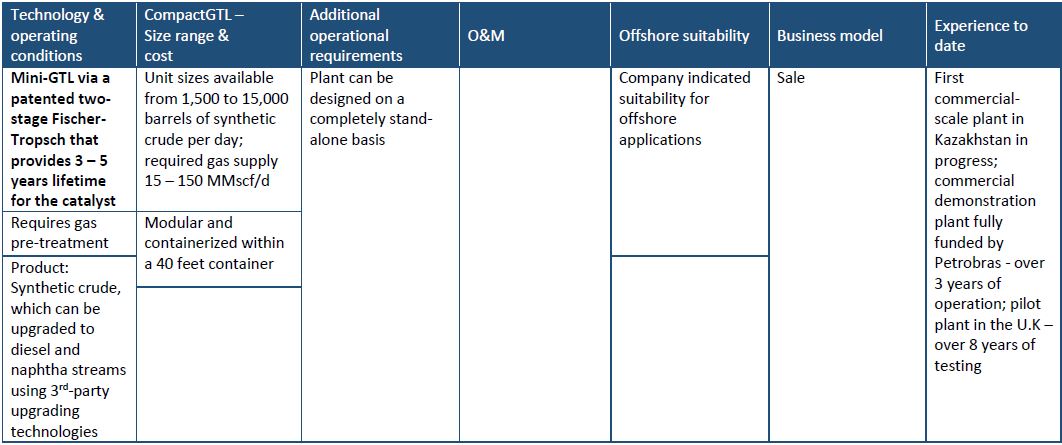


CompactGTL

compact GTL
Fig. 6 – Compact GTL’s modular plant


CompactGTL’s modular unit offers a small-scale gas-to-liquid (GTL) solution for small- and medium-sized oil field assets where no viable gas monetization option exists so that the associated gas is either flared or reinjected.

compact gtl

Tab. 2 – Compact GTL’s modular unit data


GasTechno Energy & Fuels (GEF)


LLC module


Fig. 7  – Gas Technologies LLC module


Gas Technologies LLC manufactures, installs and operates modular gas-to-liquids plants that utilize the patented GasTechno® single-step GTL conversion process. GasTechno® Mini-GTL® plants convert associated flare gas and stranded natural gas into high-value fuels and chemicals including methanol, ethanol and gasoline/diesel oxygenated fuel blends while serving to reduce greenhouse gas emissions. The unit capital cost of the plants is approximately 70% lower than traditional methanol production facilities and they require relatively limited operation & maintenance costs.


gas technotab

Tab. 3 – Gas Technologies LLC data
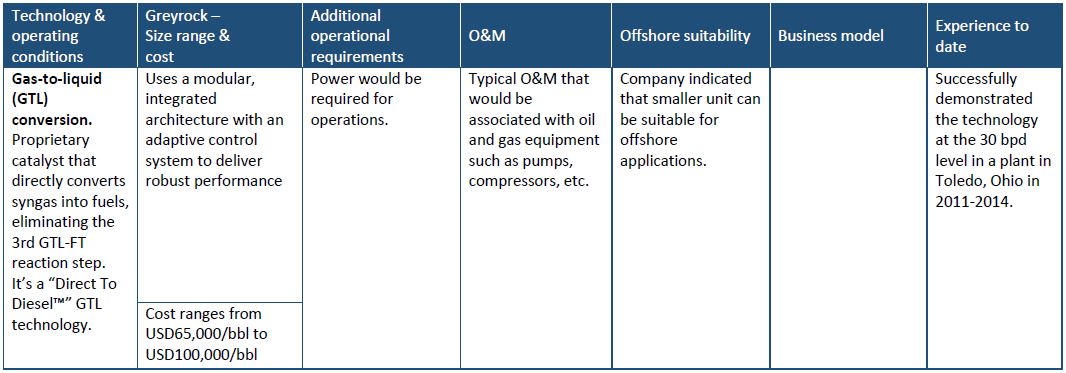


Greyrock


greyrock energy module


Fig. 8 – Greyrock Energy module P-5000


Greyrock Energy was founded in 2006 and is headquartered in Sacramento, California, with offices and a demonstration plant in Toledo, Ohio. Its sole focus is small-scale GTL Fischer-Tropsch plants for Distributed Fuel Production®, and it has a commercial offer of both a fully integrated 2000 bpd plant consuming about 20 MMscfd and smaller “MicroGTL” plants (5 – 50 bpd).


greyrock energy data

Tab. 4 – Greyrock Energy data


Velocys

velocys gtl

Fig. 9 – Velocys plant


Velocys is a smaller-scale GTL company that provides a bridge connecting stranded and low-value feedstocks, such as associated gas and landfill gas, with markets for premium products, such as renewable diesel, jet fuel and waxes. The company was formed in 2001, a spin-out of Battelle, an independent science and technology organization. In 2008, it merged with Oxford Catalysts, a product of the University of Oxford. Velocys aims to deliver economically compelling conversion solutions. It is traded on the London Stock Exchange, with offices in Houston, Texas; Columbus, Ohio; and Oxford, UK.

velocys gtl

Tab. 5 – Velocys data


Primus Green Energy


primus gtl

Fig. 10 – Primus System


Primus Green Energy is based in Hillsborough, New Jersey, USA. The company is backed by Kenon Holdings, a NYSE-listed company with offices in the United Kingdom and Singapore that operates dynamic, primarily growth-oriented, businesses. Primus Green Energy™ has developed Gas-to-Liquids technology that produces high-value liquids such as gasoline, diluents and methanol directly from natural gas or other carbon-rich feed gas.

primus gtl

Tab. 6 – Primus Green Energy data


5. Developments Remarks


DOWNSIZING ADVANTAGES

By taking advantage of new technologies, such as microchannel reactors, to shrink the FT and SMR hardware, GTL plants can be scaled down to provide a cost-effective way to take advantage of smaller gas resources. GTL plants based on the use of microchannel FT reactors can be operated on a distributed basis, with smaller plants located near gas resources and potential markets.

Smaller, modular GTL plants are suitable for use in remote locations. In contrast to conventional GTL plants, they are designed for the economical processing of smaller amounts of gas ranging from 100 million cubic meters (MMcm) to 1,500 MMcm, and they can produce 1,000 bpd–15,000 bpd of liquid fuels. The plants can be scaled to match the size of the resource, expanded as necessary, and potentially integrated with existing facilities on refinery sites.

Smaller-scale GTL operations also pose a lower risk to producers. Since the plants are smaller, construction costs are reduced; and, since the plants are modular, investment can be phased. The construction time is short, at 18–24 months. In addition, because the modules and reactors are designed only once and then manufactured many times, much of the plant can be standardized and shop-fabricated in skid-mounted modules. This reduces the cost and risk associated with building plants in remote locations. In addition, the components can be designed to use standard, off-the-shelf equipment, so there is less strain on supply chains, and the need for onsite construction work is reduced.

Since the FT process also lies at the heart of the biomass-to-liquids (BTL) processes, the same technology can be used to produce high-quality, ultra-clean diesel and jet fuel from waste biomass, including municipal waste. Smaller-scale GTL plants offer advantages at all stages of production: upstream, midstream and downstream [7].


6. GTL-FT Technology New Concepts

The small-scale processing of natural gas needs principally new technologies for converting hydrocarbons into liquid chemicals and fuels. There are several possibilities.

The first one is to develop more effective, less complex methods for converting hydrocarbon gases into syngas.

  • A very promising way to increase the efficiency and flexibility of the conversion of hydrocarbon gases into syngas is the gas-phase combustion of very rich hydrocarbon-air or hydrocarbon–oxygen mixtures in volumetric permeable matrixes. The partial oxidation of hydrocarbon gases is very attractive method for small-scale syngas production since it is an exothermic process, which therefore requires no external heating and, consequently bulky and expensive heat-exchange equipment. This circumstance makes it possible to significantly decrease the size and, hence, the cost of the reformer.

The second is to work out principally different methods for the conversion of natural gas into chemicals without the intermediate stage of syngas production, working on the composition of the used catalysts or either by developing new ones.

  • An alternative possibility to produce useful chemicals and liquid fuels from natural gas is their direct oxidation. Several direct methods of natural gas conversion into useful chemicals without intermediate production of syngas can be discussed. Among them, the most known and developed are Direct oxidation of Actually, direct partial oxidation with subsequent carbonylation and/or oligomerization of oxidation products can beconsidered as an alternative route for Gas-To-Liquids processes, which enables to avoid syngas production, the most costly andenergy-consuming stage of traditional GTL [8].

With smaller-scale GTL plants, the greatest challenge is to find ways to combine and scale down the size and cost of the reaction hardware while still maintaining sufficient capacity. This, in turn, depends on finding ways to reduce reactor size by enhancing heat-transfer and mass-transfer properties to increase productivity and intensify the syngas-generation and FT processes. The use of microchannel reactors offers a way to achieve these goals.

  • Microchannel technology is a developing field of chemical processing that intensifies chemical reactions by reducing the dimensions of the channels in reactor systems. Since heat transfer is inversely related to the size of the channels, reducing the channel diameter is an effective way of increasing heat transfer, thereby intensifying the process and enabling reactions to occur at significantly faster rates than those seen in conventional reactors.

The technology can be applied to both highly exothermic processes such as FT, and highly endothermic processes such as SMR. Microchannel FT reactors contain thousands of thin process channels filled with FT catalyst, interleaved with water-filled coolant channels. Since the small-diameter channels dissipate heat more quickly than do conventional reactors, more active FT catalysts can be used to significantly accelerate FT reactions, thereby boosting productivity.

In microchannel SMR reactors, the heat-generating combustion and SMR processes take place in adjacent channels. The high heat-transfer properties of the microchannels make the process very efficient (Fig. 4).

FT reactor gtl

Fig. 11  – An FT microchannel reactor diagram (left), and the reactor in a full-pressure shell (right)[9]


Additional improvement can be obtained by catalyst research.

  • INFRA Technology represents the new generation of GTL technology allowing the production of light synthetic crude oil straight out of the FT reactor, with four-fold performance and without byproducts (Fig. 12). The process does not require additional processing of waxes, and synthetic crude oil is fully compatible with the existing oil infrastructure.


infra


Fig. 12 New Technology applications[10]


The technology was made possible by creating a novel catalyst using cobalt as active metal in a multicomponent composite. Elimination of certain processing stages and production of high-quality, single-liquid product makes INFRA’s GTL solutions economically feasible from small-scale, pre-engineered, standardized, modular (as small as containers), easily deployed and transportable units all the way to large-scale, integrated gas processing plants.


7. Cost Analysis

By offering the ability to target supply into global-liquid-fuel-transportation markets GTL plants significantly diversify market opportunity and help to smooth financial returns in volatile conditions where gas markets prices and oil and petroleum product market prices become decoupled.


7.1 Cash Flow Analysis Methodology to Evaluate the Commerciality of GTL Projects

There are several factors that determine the cash flow and income streams associated with GTL plants. The key factors required for a methodology that analyses the commercial attractiveness of a GTL plant in a multi-year cash flow model include:

  • Cost of feedstock (natural gas, coal, petroleum coke or biomass)
  • Prices of the petroleum products and chemicals produced and sold from the plants.

Those product prices are in most cases strongly influenced by benchmark crude oil prices. GTL products generally trade in price ranges that reflect prevailing refinery and petrochemical plant crack spreads. Sometimes GTL products trade at small premiums to refinery derived products because of their superior quality (i.e. low sulphur, low aromatics in the case of diesel and gasoline).

Aspects to be considered are:

      •  If the GTL project is an integrated project then revenue from natural gas liquids extracted from the feed gas stream need to be included in the project cash flow and income calculations
      • Capital costs to construct the GTL plant, which can be usefully compared by the unit US$/ barrel/day of plant product throughput capacity
      • How capital costs are offset, recovered and/or depreciated over time and deducted as part of a taxable income methodology
      • GTL plant efficiency (i.e. unit quantities of feedstock required to produce one unit of product) on an energy and/or mass basis
      • GTL plant annual utilization rate (days/year) based upon maintenance and turnaround requirements
      • GTL plant operating and maintenance costs including the costs of catalysts, chemicals, utilities
      • Cost of transportation (shipping) between the GTL plant and the market in which the products are sold
      • Fiscal deductions applied which vary significantly from jurisdiction to jurisdiction


7.2 Cost Forecast

FT technology typically has four components: synthesis gas (syngas) generation, gas purification, FT synthesis and product upgrading. The third stage constitutes a distinctive technology that provided the basis for future technological developments and innovations. The remaining three technologies were well-known before FT invention, and have been developed separately.

The syngas is normally produced via high-temperature gasification in the presence of oxygen and steam.

For the components of the plant, some aspects can be considered for cost analysis:

          • The air separation unit typically represents a considerable CAPEX investment.
          • The economic advantages or breakthrough is in small scale GTL plants have occurred with the advances in 4 areas:
            1. Commercial introduction of micro-channel F-T technology;
            2. Higher reactive cobalt catalysts;
            3. Mass production of F-T reactors;
            4. Modular construction of the plants.
          • Another fundamental challenge is that, due to environmental regulations, heavy feed slates (primarily asphalts and heavy fuel oils) are increasingly difficult to market and, therefore, become unwanted residues rather than revenue generators. GTL technology has a clear advantage here due to its complete lack of heavy slates. This may become a strong argument for GTL in the future, especially for FT installations within existing refineries that can be used to increase the share of light and middle distillates in the overall product portfolio[11].


8. Environmental Aspects and Benefits

GTL technologies can transform off gas streams, which would otherwise be flared into valuable liquid transportation fuels and chemicals, including high-quality gasoline or methanol or a separate stream of hydrogen-rich vent gas that can be used as an additional onsite hydrogen or fuel source, so this is an ideal solution for reducing gas flaring while boosting returns.

In addition, greenhouse gas emissions can be further reduced with GTL systems through the input of CO2 streams as co-feed which is converted into gasoline or methanol, representing a valuable use for what is typically considered a low-value or even negative-value gas stream.

Properties of GTL Fuel include the enhanced aquatic and soil biodegradability, lower aquatic and soil ecotoxicity. Fuels produced from the FT process offer significantly better performance than their petroleum-based equivalents. FT-derived diesel does not contain aromatics or sulfur, and it burns cleaner than petroleum-derived fuels, resulting in lower emissions of nitrogen oxide (NOx), sulfur oxide (SOx) and particulates. Exhaust emissions experiments on GTL products revealed an overall significant reduction of CO (22%–25%), hydrocarbons (30%–40%) and NOx (6% to 8%). GTL diesel has the potential to be sold as a premium blendstock[12].

The combination of these features indicate that GTL Fuel is less likely to cause adverse environmental impacts than clean conventional fuels. In addition, FT diesel can be blended with lower-cetane, lower-quality diesels to achieve commercial diesel environmental specifications.

When the feedstock includes a renewable component, whether renewable biogas (as in the case of the ENVIA Energy project), or forestry and sawmill waste (as in the case of Red Rock Biofuels’ proposed project in Oregon), the fuels produced deliver a significant reduction in lifecycle greenhouse gas (GHG) emissions over conventionally produced fuels.

Click here for some  video:
or contact us for more information about GTL technology.

[1] http://www.gasprocessingnews.com/features/201610/smaller-scale-gtl-enters-the-mainstream.aspx
[2]www.gasprocessingnews.com/features/201706/smaller-scale-and-modular-technologies-drive-gtl-industry-forward.aspx
[3] www.theoildrum.com
[4] http://pubdocs.worldbank.org/en/492881520264957368/Mini-GTL-Bulletin-No-4-Jan-2018.pdf
[5]  EIA: International Energy Outlook, 2017.
[6] GGFR Technology Overview – Utilization of Small-Scale Associated February 2018
[7] http://www.gasprocessingnews.com/features/201310/smaller-scale-gtl-enters-the-mainstream.aspx
[8]www.researchgate.net/profile/Vladimir_Arutyunov/publication/276778347_New_concept_for_smallscale_GTL/links/59e37aefa6fdcc7154dba94a/New-concept-for-small-scale-GTL.pdf
[9] http://www.gasprocessingnews.com
[10] http://www.gasprocessingnews.com/columns/201706/gtl-viewpoint.aspx
[11] http://www.gasprocessingnews.com/features/201606/evaluate-gtl-processes-compared-with-conventional-refining.aspx
[12] http://www.gasprocessingnews.com/features/201606/evaluate-gtl-processes-compared-with-conventional-refining.aspx


Fuel Oil With 0.5% Sulfur Content


Author: Mauro Capocelli – Chemical Engineer – Researcher –University UCBM – Rome (Italy)


1.Theme Description

The presence of sulfur compounds in fuel oils causes concern both during refining processes (due to catalyst deactivation and corrosion) and during the fuel end-use, since the fuel combustion generates the emission of oxides. The main environmental concern from SOx emission is related to respiratory problems.Sulphur oxides (with water) also produces sulphuric acid, the main cause of acid rain and corrosion. Furthermore, when the emissions are in the form of sulphate particles, sulfur also contributes to the formation of particulate matter.

The original content in crude oils (organic in the form of thiols, sulphides, and thiophenic compounds and inorganic such as S, H2S, FeS2) varies from 10-2 to 8 %w (see Figure 1). Globally, the S amount in the distillation fractions increases with an increase in boiling range and the class of aromatics is the most resistant to desulfurization.

fig.1

Figure 1 – Main classes ofS-containing compounds incrude oil


Among the 100 mb/day of oil supply, about the 4% is represented by the oil-based marine fuel. Shipping is by far the main pathway of international commerce and its emissions have a worldwide dispersion (also affecting climate)[1]. For decades, the ISO has been accepted the limit of 3.5% sulphur for the heavy bunker fuel. To lower the pollution near ports, many governing bodies have established Emission Control Areas (ECA) in which the maximum sulphur(in burned fuels) is limited. The allowable level in these region has been reduced from 1.5 % (2010) to the present 0.1%. On the other hand, the International Maritime Organization (IMO) has planned to lower the sulphur content to 0.5%w from the 2020. Many Chinese ports, including Shenzen and Shangai, are going to implement the IMO compliance of 0.5% sulphur limit. These regulations require a very deep desulfurization to meet the ultra-low sulfur diesel (ULSD)specifications(15 ppm).According to McKinsey & Co., the shipping industry will react by switching to a combination of marine gasoil and low-sulfur residuals […] generating, very attractive investment on sulfur removal technologies.>>[2]

grafico

Figure 2 –  Sulphur content in bunker fuels according toIMO regulations.


2.Technological Options & Challenges

Foster Wheeler examined the impact of the new regulations on a typical refinery concluding that the new targets will be achieved by processing the crudes with the lowest S-content or by increasing the blending with distillates. From the market point of view, particularly if considering the SECA regulations, the distillate production will be under pressure and the new capital costs (upgrading/retrofit) will increase the price of bunker fuels up to the diesel level.[3]On the other hand, novel Desulfurization Projects (50-100 in the next 12 years) will be needed to produce ~200·106 tonnes/year of residue meeting the future specifications. In synthesis, the options available to meet the future environmental standards are:

  1. A switch in crude selection rather than investing in expensive desulfurization. This means an increased demand for sweet crudes (Africa, Southeast Asia) at the expense of sour grades (from Middle East);about that, Stockle and Knight assert that few crudes are able to produce  a  fuel  oil  meeting  this specification without  some  sort  of  residue upgrading/desulphurisation3.
  2. Blending with low-sulphur distillates. This could cause the cited economic consequences as well as possible technical issues for ship engineers in terms of engine failure (stability and compatibility).
  3. Moving towards alternative fuels, mainly LNG or Methanol LNG, now accounting for an additional 0.3 mb/d of bunker demand, represents an interesting opportunity for ferry routes and river transportation.
  4. Installation of advanced flue gas scrubbing technology; the main issue is the liquid discharge into the environment
  5. Development of novel “breakthrough“ desulphurization processes and/or drastic change in refinery operation. In the following, the main technological options of heavy fuel desulfurization are described.


2.1 Hydrodesulfurization (HDS)

It is the most common technique, already implemented in any refinery system, and needs hydrogen as a reactant and a catalyst (typically Co-Mo/Al2O3 and Ni-Mo/Al2O3) to convert sulfur compounds into H2S. Typical operating conditions are high temperature (>300) and pressures (>100 bar). Heterocyclic compounds are hardly removed (due to steric-hindered adsorption on catalyst surface) while thiols and sulfides are completely converted into H2S. This latter is subsequently separated from fuel oil sand oxidized into elemental sulfur (Claus Process). HDS can be applied to different streams of the overall refining process: i) Pre-upgrading (e.g. VGO hydro treating); ii) Residue upgrading gas well as iii) Whole Crude hydrotreatment generating directly low-sulphur crudes. These solutions are discussed in the report by Foster & Wheeler that also points out the increase in carbon emission related to the new refinery configurations able to meet these standards[4].

The overall effectiveness of HDS is limited by: i) metal content of heavy oils; ii) coking and fouling potential; iii) steric hindrance, during both the catalytic reaction and the adsorption.[5]In conclusion, to push forward the HDS in order to meet standards of ULSD means: high pressure and temperature (requiring high capital and operating costs), limited catalyst life and high energy and carbon footprint.

fig 2

fig 3

Figure 3- Possible locations of hydrotreating units in the oil refinery


2.2 Adsorptive desulfurization (ADS)

This process, consisting in confining S-compounds onto a solid matrix, depends on the selectivity of the sorbent as well as on the regeneration method. Several sorbent materials have been evaluated for both model oils and distillates: activated carbon, silica-aluminas, zeolites, Gallium+Y-zeolites, Cu-zirconia and metal organic framework[6]. Acceptable desulfurization levels can be achieved under mild conditions from the experimental point of view. On the other hand, the process reliability is still not sufficient for industrial applications. Moreover, heavy oils present large molecules that strongly reduce the adsorption efficiency due to steric hindrance.

2.3 Bio-desulfurization(BDS)

This process does not require hydrogen and external energy since it implements microorganisms to remove S atoms from organic compounds. It is still not practicable on industrial scale. Some experimental evidences have been presented in the literature for model matrix6.

2.4 Extractive desulfurization (EDS)

Extractive desulfurization does not require hydrogen and can be operated at mild conditions. On the other hand, the system thermodynamics influences the process efficiency since i) the solubility of the compounds in the solvent (acetone, ethanol, polyethylene glycols, etc.) limits the extraction yield, ii) the solvent and the oil should be immiscible to minimize the solvent losses; iii) the viscosity of fluids worsen the mixing, iv) the vapor pressure of the solvent limits the operating conditions; v) the solvent may contain other compounds extracted from the oil. Because of these drawbacks the energy footprint of the solvent regeneration could be very high.

2.5 Oxidative desulfurization (ODS)

ODS is a viable alternative to HDS since oxidized sulfur compounds can be “easily” removed. The subsequent separation can be achieved by physical methods (e.g. extraction by non-miscible polar solvent followed by gravity, adsorption or centrifugal separation); oxidized sulfur can be also removed by thermal decomposition. Follow by EDS, the oxidation does not mitigate the solvent loss and energy cost (abovementioned solvent regenerating issues) but increases the process selectivity.

The process require oxidant (H2O2 among the best, other represented in the figure below) a catalyst (e.g. acids) and a phase-transfer agent (PTA) when the mass transfer across the aqueous and oil phases represents the rate-limiting step (to enhance the kinetics of the liquid-liquid heterogeneous reaction system).

grafico2

Figure 4 – Active oxygen for different oxidants


In factPTAs is able to form a complex with the oxidant in the aqueous phase transporting it across the interface. In synthesis, ODS can be obtained i) in an acidic medium, ii) by an oxidizing agent, iii) by autoxidation, iv) by catalytic oxidation, v) by photochemical oxidation, vii) by ultrasound oxidation.

formula2

Several companies and research groups introduced the intensification effect by means of Ultrasounds (US). SulphCo’s patented technology uses Ultrasound to induce cavitation in a water/oil stream[7]. During the Ultrasonic Cavitation (under the influence of the pressure rarefaction), cavities arise from dissolved gases by partial vaporization. Depending on the size of these cavities and the pressure variations, they undergo into a radial motion: the negative pressure induces expansion of the cavity until the attainment of a maximum radius. These vapor bubbles undergo a subsequent compression phase causing the rapid compression. The collapse dynamic is faster than mass and heat transfer (the temperature increasing is comparable with an adiabatic compression with heating rates > 109 K s-1) and leads to high pressures ( >100 bar) and temperatures ( > 5000 K ).;

formula

where Ta is the ambient temperature, Pi is the pressure inside the bubble at its maximum size and Pa  is the ambient pressure at the moment of transient collapse. Thanks to these local extreme conditions, the collapsing cavity becomes an “hot spot”, concentrating the energy in very small zones. At the final moment of bubble collapse, wall motion is far more rapid than diffusion dynamics of water vapor: the entrapped molecules dissociates forming radical species.

On this basis, chemical reactions and physical consequences (intense shear, mixing and high localized pressure and temperature)induce and accelerate several chemical processes[8].

fig 5

Figure 5- Sinusoidal acoustic pressure and related single bubble radius-time curve (during acoustic cavitation).


SulphCO® Technology demonstrated the efficient conversion of sulfides and other S species to sulfones (easily removed by downstream separation). Several research groups have tested the US to globally overcome the mass transfer limits and increase the reaction kinetics. Akbari et al. investigated the intensification effect that US produces on the efficiency and the catalyst deactivation during the oxidative desulfurization of model diesel over MoO3/Al2O3.[9]Bolla et al. studied the phenomenology of US-assisted ODS of Liquid Fuels by simulating the bubble dynamics, the involved chemical reactions as well as by observing the combination of oxidizing agents (e.g. Fenton reagent) and ultrasounds[10].Bhasarkar et al. investigated the contemporary use of ultrasound and PTA for ODS. Good conversion has been observed in the simultaneous desulfurization/denitrification of liquid fuels in sonochemical flow-reactors[11]. Different improvements achieved by the US implementation in industrial desulfurization processes are described by Wu and Ondruschka 2010[12].

Ionic liquids (ILs)have been implemented for their extraction characteristics in combined EDS/ODS schemes (see Figure 6). ILs consist of organic cations and inorganic anions; they are high boiling solvents and can be tuned to meet the requirement of specific applications. Low viscosity ILs showed remarkable results for their regeneration (by a simple water dilution and vacuum distillation process).[13]

The process efficiency increases with oxidized compounds (sulfoxides and sulfones) but ILS are also able to obtain good removal of heterocyclic S-compounds. The possible reaction patterns, regeneration features as well as future challenges and perspectives have been described by Bhutto et al.[14]

fig 6

Figure 6 – Simplified process scheme of ILS-assisted desulfurization


[1]Di Natale, Carotenuto Particulate matter in marine diesel engines exhausts: Emission sand control strategies. Transportation Research Part D 40 (2015) 166–191
[2]https://www.mckinseyenergyinsights.com/insights/marpol-implications-on-refining-and-shipping-markets/https://www.platts.com/ShippingNews/26935712
[3]M. Stockle and T. Knight,(2009) Foster Wheeler Energy Limited. Impact of low-sulphur bunkers on refineries. http://www.digitalrefining.com/article/1000090,Impact_of_low_sulphur_bunkers on_refineries.html#.WtTCx4hubIU
[4]M. Stockle and T. Knight,(2009) Foster Wheeler Energy Limited. Impact of low-sulphur bunkers on refineries. http://www.digitalrefining.com/article/1000090,Impact_of_low_sulphur_bunkers on_refineries.html#.WtTCx4hubIU.
[5] Bhutto et al., 2016. Oxidative desulfurization of fuel oils using ionic liquids: A review. Journal of the Taiwan Institute of Chemical Engineers Volume 62, May 2016, Pages 84-97.
[6]R.Javadli and A. de Klerk Desulfurization of heavy oil Appl Petrochem Res (2012) 1:3–19. DOI 10.1007/s13203-012-0006-6. Bhutto et al., 2016. Oxidative desulfurization of fuel oils using ionic liquids: A review. Journal of the Taiwan Institute of Chemical Engineers Volume 62, May 2016, Pages 84-97.
[7]SulphCO ®“Oxidative Desulfurization”. IAEE Houston Chapter June 11, 2009 https://www.usaee.org/chapters/documents/Houston_090611.pdfhttps://www.usaee.org/chapters/documents/Houston_090611.pdf.
[8] Capocelli et al., Sonochemical degradation of estradiols: Incidence of ultrasonic frequency. Chemical Engineering Journal 210, pp. 9-17
[9] A. Akbari et al. / Investigation of process variables and intensification effects of ultrasound applied in oxidative desulfurization of model diesel over MoO3/Al2O3 catalys. Ultrasonics Sonochemistry 21 (2014) 692–705.
[10] Manohar Kumar Bolla, Mechanistic Features of Ultrasound-Assisted Oxidative Desulfurization of Liquid Fuels.  dx.doi.org/10.1021/ie300807a| Ind. Eng. Chem. Res. 2012, 51, 9705−9712.
[11]Gaudino et al., 2014 Efficient H2O2/CH3COOH oxidative desulfurization/denitrification of liquid fuels in sonochemical flow-reactors Ultrasonics Sonochemistry 21 (2014) 283–288.
[12]Z. Wu, B. Ondruschka.Ultrasound-assisted oxidative desulfurization of liquid fuels and its industrial application
Ultrasonics Sonochemistry 17 (2010) 1027–1032.
[13]R.Abro, A review of extractive desulfurization of fuel oilsusing ionic liquids, RSC Adv.,2014,4, 35302.
[14] Bhutto et al., 2016. Oxidative desulfurization of fuel oils using ionic liquids: A review. Journal of the Taiwan Institute of Chemical Engineers Volume 62, May 2016, Pages 84-97.


Potential Opportunities of Self-Healing Polymers

Author: Mauro Capocelli – Chemical Engineer – Researcher –University UCBM – Rome (Italy)


1. Theme Description

Polymers are widespread in different sectors, from packaging to construction. As shown in Figure 1, polymer production reached about 400 Mton in 2015[1] and is expected to grow with a CAGR of 3.9% in the period 2015-2020.[2]The production interests mainly the packaging (36%), building and construction (16%) and textiles (15%), while referring to the polymer type, the main ones are: PP (17%), LDPE (16%) and PPA fibers (15%).[3]The leading companies are Dow Chemical, BASF SE, Saudi Basic Industries Corporation, China Petrochemical Corporation, and Exxon Mobil.2 Whereas the main producing countries are China (29%), Europe (19%) and NAFTA (18%)[4].In this scenario among emerging polymers there are self-healing polymers that falls into the class of smart polymers[5]. It is considered that in 2025 these compounds could carry to4.1 billion of US$ with a CAGR of 27.2%.[6] Therefore in the following sections self-healing polymers and their characteristic are described.


Fig. 1

Figure 1 – World Plastic Production referring to Use Sector and Polymer Type from 1950 to 2015.3


2. Self-Healing Polymers

Self-healing polymers are materials that have “the capability to repair themselves when they are damaged without the need for detection or repair by manual intervention of any kind.[7]When cracks begin these lead to the chain cleavage and/or slippage with the formation of reactive groups. These groups can form oxidative products or rearrange themselves to repair the leak.[8]According to the operation mechanism, self-healing can be divided into: extrinsic and intrinsic, automatic and non-automatic. In the first case the damage is repaired by means of an external agent put inside the matrix. The external agent can be liquid (confined into microcapsules, hollow fibers and microvascular networks) or solid (dispersed in a polymeric matrix). Whereas intrinsic ones can repair by themselves.[9] Referring to non-automatic materials, they need of an external stimulus such as light, heat, laser beam, chemical and mechanical to repair the crack. While for the automatic ones the repair is spontaneous.[10]

Fig. 2

Figure 2 – Schematic representation of extrinsic/intrinsic self-healing polymers.10


Intrinsic Self-Healing Polymers

The cracks are repaired by local increase in the mobility of the polymeric chains. This is possible thanks to the reduction of the material viscosity and using an external/internal stimulus such as thermal energy, irradiation, pH changes, etc. (Figure 3).After cooling, the local properties are restored and the material can be used again. There are several parameters that can be modified to ensure good physical and mechanical properties: such as molecular weight, cluster distribution and size, crystallinity etc.[11]


Fig. 3

Figure 3 – Viscosity and temperature trends from the damage to repair process.11


On the basis of the healing mechanism these compounds can be divided into: polymers based on reversible covalent bonds, supramolecular polymers and shape memory polymers. The first category includes several bonds such as disulphide, imine, acyl hydrazones etc.[12]However, the most common are based on Diels-Alder/retro Diels-Alder reactions.[13] These are called [4+2] cycloaddition reactions because involve 4π electrons of the diene and 2π electrons of the dienophile.  The most known and used system is the furan/maleimide due to low healing temperature near to 100 °C (for more details can be consulted A. Gandini).[14] In supramolecular polymers[15], monomers are held together by means of non-covalent interaction such as hydrogen bonding, π-π stacking interactions, metal ligand complexes and ionomers.9 Compared to covalent bonds, non-covalent ones are weaker but more reversible. The shape memory polymers[16], instead, are compounds that can be plastically deformed, but by means of external stimuli such as heat, light etc. can return to the original shape. The matrix is usually composed by two domains: one acts as netpoints defining the original shape of polymer and the other one acts as molecular switches having memory of the original shape. A trade-off between mechanical strengths and healing capacity is represented by polymer blends[17] (for more detail can be consulted L. A. Utracki et al.).[18]


Extrinsic Self-Healing Polymers

Unlike intrinsic self-heling polymers, the extrinsic ones need of external agent, placed inside the material matrix, to repair the damage. The healing agent can be confined as liquid into capsules or networks such as capillaries and hollow fiber or blended as solid into the polymer. The healing agent is then released due to the rupture of these containers reaching the cracks by means of capillary forces. Microencapsulation and Microvascular network are the most common techniques for making extrinsic self-healing polymers. In the first case the healing agent can be encapsulated by means of the reactions of several mixtures (urea-formaldehyde, melamine-formaldehyde etc.)  in an oil-water emulsion(in situ and interfacial techniques) or by the dispersion of the key component in a melted polymer. This compound is emulsified and solidified by changing the temperature or removing the solvent.[19] It is necessary that the healing agent has low viscosity, good wettability and minimum loses due to volatilisation or diffusion into the polymer matrix. Form the first system based on styrene/polysterene blends and phenolic based resin we move on dicyclopentadiene monomer (DCPD) with “Grubbs catalyst” up to the polydimethylsiloxane (PDMS).[20]Referring to vascular networks the most common technique is based on hollow glass tubes with different configuration: all tubes are filled with only one type of resin such as epoxy particles or cyanoacrylate or with two “adhesives” such as epoxy and its curing agent. Otherwise one of the compounds can be injected in the tubes and the other one in microcapsules.[21] However these techniques allow to create 1-2D networks. An emerging method consists of making a scaffold that after solidification is removed from the polymer matrix. This allow to create a 3D structure. The healing agent is then injected in the network.19


Fig. 4

Figure 4–A) Operatingmechanism of capsuled and vascular networks,[22]B)SEM of the rupture of anurea-formaldehyde microcapsule in a thermosetting matrix[23], C)Optical Image showing the released of healing agent.[24]


Healing Efficiency

The main techniques used to evaluate the healing efficiency are Undamaged Tapered Double Cantilever Beam (TDCB) and Tear Test. In the first case the crack is generated in the center of the sample and is propagate until failure. Then the coupon is repaired by means of healing properties of the material and loaded again. Whereas Tear Test is used for elastomeric material such as PDMS. The rectangular sample has an axial cut and two legs that are loaded until the cracks propagates to the rest of the material.  The healing efficiency is worked out comparing the property of virgin sample.[25]

formule


Where KIC fracture toughness, PC critical fracture load, T tear strength and FAvg is the mean tearing force.


Fig. 5

Figure 5 – A) TDCB sample[26], B) Tear Test.[27]


3. Last Advancement in Self-Healing Polymers

Among intrinsic self-healing polymer an emerging technique is represented by the injection of a thermoplastic particles (250-425 μm) of polyethylene-co-methacrylicacid (EMAA), into diglycidyl ether of bisphenol A (DGEBA) epoxy resin polymerized with triethyltetramine (TETA). The TDCB test performed at 150°C for 30 minutes showed a healing efficiency of about 85%.  This was achieved by the formation of bubble that expanding forcing the healing agent into cracks.[28]

Keller at al. in their first work tested a matrix of Sylgard 184 PDMS provided by Dow Corning in which the healing agent was confined into two different urea-formaldehyde capsules: one containing a vinyl terminated poly-dimethyl siloxane (PDMS) resin and platinum catalyst and the other containing a PDMS copolymer diluted with a 20 wt% of heptane to reduce the resin viscosity. Therefore, polymer and healing agent have the same nature. Tear tests showed a healing efficiency ranging between 70-100%.[29]In a subsequent work the same polymer and the elastomer RTV 630 provided by GE Silicones were tested under torsional fatigue. The experiments involved four samples for each compound with different amount of substance in both capsules. The results showed that torsional stiffness was recovered after 5hours while the fatigue crack was reduced by 24%.[30]

Toohey et al. instead tried to mimic human skin creating a 3D microvascular network covered by an epoxy substrate.  The coating contained “Grubbs” catalysts while the structure was filled with DCPD healing agent. Furthermore, an acoustic emission sensor was used to detect the crack events. The concentration of catalyst was increased up to 10 % w/w showing a maximum number of cycle equal to seven.[31] Therefore, to obtain a greater number of cycles this structure was modified by introducing a multiple isolated network structure where different healing agents can be confined. In this way a two part (epoxy resin-amine harder)altering structure was obtained and the number of cycle was increased up to 16.[32]

An exhaustive description of the last advancement in self-healing polymers can be found in Zhag et. al [33] and Mauldin et. al20.

Fig. 6

Figure 6–Operation of EMAA particles.[34]

4. Conclusions

Self-healing polymers are promising smart materials that try to mimic the nature (i.e. healing a skin wound, broken bone etc.) repairing themselves without an external intervention of any kind (i.e welding, fusion etc.)10. These compounds can be applied in several sectors from packaging up to aerospace[35], from coating to corrosion prevention22and it is estimated that in 2025 could have a market size of 4.1 billion of US$ with a CAGR of 27.2%.6Nowadays,they are divided into extrinsic and intrinsic, automatic and non-automatic polymer depending on the mechanism of action. Some emerging material are listed from EMAA particles up to 3D microvascular network. However, these works are concerning the laboratory scale and only few products are available. Therefore, more efforts are necessary for the commercialization.


[1]http://advances.sciencemag.org/content/3/7/e1700782.full
[2]https://www.marketresearch.com/product/sample-8837209.pdf
[3]http://advances.sciencemag.org/content/advances/suppl/2017/07/17/3.7.e1700782.DC1/1700782_SM.pdf
[4]https://www.statista.com/statistics/281126/global-plastics-production-share-of-various-countries-and-regions/
[5]https://www.sciencedirect.com/science/article/pii/B9780857096951500017
[6]https://www.grandviewresearch.com/press-release/global-self-healing-materials-market
[7] Wilson, G. O., Andersson, H. M., White, S. R., Sottos, N. R., Moore, J. S. and Braun, P. V. 2010. Self-Healing Polymers. Encyclopedia of Polymer Science and Technology.
[8] Y. Yang and M.W. Urban, Self-healing polymeric materials, Chem. Soc. Rev., 2013,42, 7446-7467.
[9]G. Li and H. Meng,Recent Advances in Smart Self-healing Polymers and Composites, Woodhead Publishing Series in Composites Science and Engineering: Number 58, 2015.
[10] http://www.mdpi.com/2073-4360/9/10/535/htm
[11] https://www.sciencedirect.com/science/article/pii/S0014305714000366
[12] https://www.ncbi.nlm.nih.gov/pmc/articles/PMC5129565/
[13] http://www.scielo.br/scielo.php?script=sci_arttext&pid=S0104-14282005000200007
[14] A. Gandini, The furan/maleimide Diels–Alder reaction: A versatile click–unclick tool in macromolecular synthesis,Progress in Polymer Science, 2013, 38 (1), pp 1-29.
[15] https://www.sciencedirect.com/science/article/pii/S1369702104001877
[16] https://www.sciencedirect.com/science/article/pii/S1369702107700470
[17]https://www.politesi.polimi.it/bitstream/10589/89593/1/2014_3_PhD_Grande.pdf
[18] L.A.Utracki, C. Wilkie, Polymer Blends Handbook, 2nd edition, Springer 2014.
[19] http://sottosgroup.beckman.illinois.edu/nrs098.pdf
[20] https://www.tandfonline.com/doi/pdf/10.1179/095066010X12646898728408
[21] https://pdfs.semanticscholar.org/d102/f2dc25d097146e5da90653de98de5c3b6902.pdf
[22] https://www.sciencedirect.com/science/article/pii/S1385894718303942
[23] http://autonomic.beckman.illinois.edu/rupture.html
[24]http://autonomic.beckman.illinois.edu/mvac.html
[25] https://www.hindawi.com/journals/amse/2012/854203/
[26]https://www.sciencedirect.com/science/article/pii/S0020768315001353#f0010
[27] https://www.azonano.com/article.aspx?ArticleID=3007
[28]S. Meure et al.,Polyethylene-co-methacrylic acid healing agents for mendable epoxy resins, Acta Materialia,  57 (14)   2009, pp. 4312-4320.
[29] http://whitegroup.beckman.illinois.edu/journal%20articles/nrs062.pdf
[30] https://pdfs.semanticscholar.org/ee94/62040b27585b959702b03a9aed1f25194430.pdf
[31] https://lewisgroup.seas.harvard.edu/files/lewisgroup/files/toohey_natmat_2007.pdf
[32] http://autonomic.beckman.illinois.edu/nrs086.pdf
[33] Zhang et al.Basics of self-healing: State of the art. In Self-Healing Polymers and Polymer Composites, JohnWiley & Sons, 2011; pp. 1–81.
[34] https://www.sciencedirect.com/science/article/pii/S1359645409003449
[35]Wolfgang H. Binder, Self‐Healing Polymers: From Principles to Applications, Wiley‐VCH, 2013.


Hydrodynamic in Nanopores: Applications for Recovery of Unconventional Resources or for Energy Storage

Author: Giovanni Franchi-Chemical Engineer-PhD Student -University UCBM – Rome (Italy)


1.Theme Description

World oil demand is growing steadily. Today it reaches about 100 million b/d[1]. Conventional oil reserves are about 1/3 of the non-conventional ones[2] such as: heavy oil, tight oil, shale gas, methane hydrates etc. These resources are deployed on extensive areas and need of specific technologies to be extracted. Hence nowadays, they are very expensive compared to the conventional ones.[3],[4]Several Enhanced Oil Recovery Technologies exist (Thermal, Gas and Chemical) but they don’t exceed 40% of recovery. Hence, to increase this percentage isnecessary to better understand the transport of oil and gas into nanopores rocks.Indeed, due to dimension of pores and the rock heterogeneity the flow description with conventionalmathematical modelareno longer suitable[5].In the following sections the flow in nanopores rocks, the mathematical tools, simulations and experimental studies are described.

2.Transport in Material with Complex Pore Geometries

The flow through the nanopores rocks takes place within channels less than 100 nm[6] and can’t be described by conventional models. Unlike conventional reservoirs, theunconventional ones, indeed, have worse features of porous bed. The porosityis between 2-6%, the permeability can change quickly from 0.001 μD up to 1 mDand the system is oil wet rock (the contact angle between fluid and rock is more than 90°C).[7] Referringfor example to tight oil, the pore diameter is between 30-200 nm including micro-macro and meso-pores. The reservoir is formed by several zones such as oil+mobile water and gas+oil+immobile water as shown in Figure 1. The oil productionreaches low flow rates in 9-12 months. Therefore, as described in the following sections several techniques have been studied to enhance oil recovery.[8]

fig.1

Figure 1 -Conventional Reservoir Vs Tight Oil.[9]


Flow Regimes

The flow depends on Knudsen number5 and due to pore diameter, it isn’t continuum. Therefore, it can’t be described by Darcy law, but slip, transitionand free-molecule flow need to be considered. Boltzmann equation can be solved to describe the flow (Figure 2), but to reduce computational costs it is solved only for simple problems. Hence, several mathematical models are used such as Molecular Dynamics (MD), Direct Simulation Monte Carlo, Burnett equation and reduced order Boltzmann equation (LBM and Grads)[10]. Hou et al.[11]has proposed to combine the positive aspects of LBM and MD methods. In this way, MD is suitable to describe the fluid flow near the surfacesofporous media while LBM allows to describe the rest of the flux,saving time by means of simplified kinetics models.

fig.2

Figure 2 -Flow Regimes depending on Knudsen number[12]


Computational Analysis

On computational level the porous medium can be simulated in different ways. For example, Unfractured Porous Media can be described by means of[13]:One-Dimensional Models, where pore spaces are considered like a series of capillary tubes in which the radius can be the same for all or not. The model can take into account the tortuosity, but itcan’t describe the interconnectivity of the pores.Continuum Models,where the domainis considered as a distribution of identical spheres. The model can represent anunconsolidated or consolidated porous medium depending on the overlap of the interconnections.Random Hydraulic Conductivity Models,in which domainis divided into rectangles with a random hydraulic conductivity.While, referring to Fractured Porous Media the principlemodels are14:Models of a Single Fracture,where the simplest model is represented by two parallel flat plates. It can be solved analytically, but it isn’t suitable to describe the internal morphology of the fracture; indeed, it doesn’ttake into account the roughness of the fracture. Models of Fracture Networks,in whichfractured rocks are described as a network of interconnected elements. In this way is possible to describe the flow in the fractures by means of 2D and 3D models. Models of Fractured Porous Mediaare suitable for describing flow in matrices with high permeability. These models include double porosity andpermeability models (see for example the model used byFragoso Amaya[14]). In the former the matrix acts as medium storage, while in the latter both matrix and fractures networks contribute to transport and fluid flow.

3. Methods to Improve the Recovery of Chemical Transformation Processes

There are several techniques that allow to improve oil recovery and can be classified into primary, secondary and tertiary recovery[15],[16]. The former consists of the extraction of oil via natural rise or pumps. It let to recover only 5-15% of hydrocarbons. Secondary recovery, instead, consists of the injection of water/gas in the reservoirs. It let to reach 30% of recovery while Tertiary recoverytries to make the ground more suitable to the extraction of oil. Currently these technologies don’t exceed 40%.[17]Oil recovery from reservoirs, indeed, depends on different factors such as the Mobility Ratio (M) and Capillary Number (Nc)[18].The first represents the oil capacity to move through the pores. If M >1, more fluid needs to be injected to obtain an optimal oil saturation into the pore. While M <1, means that mobility ratio is favourable. This can achieve by reducing viscosity of oil (i.e. with thermal techniques) or by increasing viscosity of displacing fluid (i.e. with chemical techniques). The capillary number, instead, measures the relative weight of viscous forces against interfacial tension. In the following section the main techniques to improve oil recovery are described.


Thermal Enhanced Oil Recovery (TEOR)

This technique is applied to heavy crude oil with[19]: API Gravity between 10-20°, reservoirs depth less than 3000 ft, permeability of 500 mDand sand thickness between 30-50 ft. It includes Steam Injectionand In-situ combustion. The firstconsists of the injection of hot steam into the reservoirreducingviscosity of heavy oil and increases the pressure[20]. Steam can be injected periodically (Cyclic steam Injection)[21] or by means of two horizontal wells (Steam assisted gravity drainage, SAGD), where the oil is drained into the lower well by means of gravity[22]. In situ combustionconsists of the injection of dry air or wet air into the reservoir. The combustion of part of the heavy oil (5-10% of the crude oil)[23] generates a combustionfront that flows along the reservoir. This front is sustaining by means of the coke present in the reservoir or in the case of wet air by means of steam produced.[24],[25]


Gas Enhanced Oil Recovery (GEOR)

This technology includes Miscible Gas Injectionand Immiscible Gas Injection. In the former CO2 or N2are used to increase oil recovery. As shown in Figure 3 a) the carbon dioxide is injected at 1200 psi and density 5 lb/gal, it mixes with oil trapped into pores forming a concentrated mixture that goes back to the surface. Then, CO2is removed from the mixture, recompressed and injected again in the reservoir [26].

The CO2 flooding is also a promising technique for tight oil reservoirs. Indeed, waterflooding could form a film on the pore surface decreasing the recovery. In figure 3 b) is shown the common techniques used in tight oil. The wells move vertical until tight formation and then parallel to reservoir. The gas in injected to fractur the rocks allowing to oil to move into wells.[27]

fig.3

Figure 3– a) Waterflooding and Carbon Dioxide injection; [26] b)Fracking in tight oil.[28]


The Immiscible Gas Injectionconsists of the injection of gas under Minimum Miscibility Pressure (MMP). This technique is suitable for light oil rather than heavy oil.[18]


Chemical Enhanced Oil Recovery (CEOR)

In the case of heterogeneous reservoir CEOR is better than GEOR. This technique, indeed, reducesthe interfacial tension, wettability and mobility.[29]It includesPolymer Flooding, Surfactant Flooding and Alkaline Flooding.The formeris used to minimize bypass effects due to capillary forces and to increase water viscosity. Usually, the polymers injected in the reservoir are about the 30% (minimum) of the reservoir pore volume. They can be divided into two categories biopolymer and synthetic polymer[30]. Surfactant, instead, reduces interfacial tension between oil and water and alters wettability, butpart of these substancesis adsorbed onto the rock surface.[31]Alkaline flooding is very efficient in reservoirs with high acid content. Indeed, the alkaline reacts with the acid form a surfactant solution that allows to reduce interfacial tension, emulsification and alters wettability.[32]Combinations of the previous solutions such as Surfactant Polymer Floodingand Alkaline Surfactant Polymer Flooding are often used.


Nanoparticles to Enhance Oil Recovery

Nanoparticles are having great attention as emerging technologies to be employedin oil & gas field. These materials, indeed, could be used as sensors to be injected into the wells to understand the property of reservoir (pH, hydrocarbon saturation etc.) or as “smart-fluid” for increasing oil recovery altering wettability (more water-wet), improving mobility ratio and reducing interfacial tension[33].“Smart fluid” can be divided into three groups: metal oxide (Al2O3, CuO, Fe2O3/Fe3O4 etc.),organic (i.e. carbon nanotubes) and inorganic (i.e. silica).[34]In Figure 4 is represented the structure of nanoparticles used to evaluate the oil recovery of Berea sandstone  sample having 17.45 API, air and liquid permeability of 184 mD and 60 mD respectively and a porosity of 20%. The better response is given by a mixture of aluminium oxide and silica oxide at a concentration of 0.05 wt. due to reduction of interfacial tension.[35]

Among them emerging nanoparticlesare represented by carbon nanotubes(CNT). These compounds fall in fullerene category, have good resistance to corrosion. They can be arranged in single or multiple wall made of graphene and the surface is hydrophobic with high slip length.6,34For other applications of nanoparticles in oil and gas industry such as corrosion inhibition, methane release from gas hydrate, etc. it can be consulted Fakoya et al.[36]

fig.4

Figure 4– Smart fluid application on Berea sandstone sample: (a) titanium oxide, (b) aluminium oxide, (c) nickel oxide and (d) silica.[37]


4. Simulation Studies and Experimental Works

In literature there are several simulation studies some of them are summarized in this section.Moraes de Almeida et al.[38]described the fluid flow of water and light crude oil on silica nanoporesby means of Molecular Dynamics. The nanopores were simulated with two hydrophilic terminations (silanol and siloxane rich) and three different scenarioswere considered: water/oil infiltration on empty nanopores and water infiltration on oil filled nanopores and vice versa. For empty nanoporesboth water and oil infiltrated quickly (0.5 ns for oil and 1 ns for water) and the interfacial tension was reduced of about 35% for oil/siloxane terminations. For the other cases water infiltration on water/oil filled wasensuredat10 and 5000 atm respectively while oil infiltration on water filled occurs at 600 atm. Ross et al.[39]studied friction coefficient for the fluid flow of water inside flat graphitic slabs (5 x 5 nm) and inside/outside carbon nano-tubes (5 nm length) varying the characteristics length of the two configurations.Molecular Dynamics model was used considering no-slip conditions at solid-fluid interfaces. In this way was possible to calculate the slip length. Tests showed that friction coefficients depended on the curvature of porous surfaces. In particular, they were higher in presence of convex surfaces and lower for concave ones.Lee et al.[40]treated hydrocarbon recovery from shale gas. They simulated kerogen structure by means of several models (disordered, ordered and composite) based onmolecular and statistical simulation.The recovery depends on interfacial tension and is thermally activated. Particularly the energy barrier is strong for immiscible fluids such as water while it is less for miscible ones such as CO2 and C3H8. Despite carbon dioxide, propane is recovered together with the methane extracted.


fig.5


Figure 5– Model simulations and Results in presence of Water: a) I,II and III represent three different structures considered in the simulations; b) I and II outline the starting and end points of the simulation where the methane is trapped inside a CNT membrane with a triangular shape (yellow). The left side is set at constant pressure by methane while the right side is maintained at low pressure by water; c) It is shown the amount of methane extracted from the pores as function of time.[41]


Alfarge et al.[42] simulated oil recovery from Bakken formation injected three different miscible gases such asCO2, lean and rich gas. The well was stimulated by means of 5 hydraulic fractures spacing of about 200 ft. The test showed at first high production but then a rapid decline due to reduction of pressure nearby the production well.Three different scenarios were simulated changing the number of cycles from two to ten, the duration of injection from two months to six and the duration of soaking from one month to three.The use of CO2 increased molar diffusivity, while rich gases needed a major soaking period despite lean gases that requiredmore volume to be injected. Prajapati et al.[43]simulated the flow through shale reservoirs. They considered a binary mixture of CH4-CO2 flowing through a kerogen matrix by means of four models: Wilke, Wilke-Bonsaquet, Maxwell-Stefan and Dusty Gas Model. This led to a system of nonlinear equations solved by means of COMSOL Multiphysics. It was demonstrated that Knudsen diffusion and binary molecular diffusion had to be considered, indeed the flux is 10 times higher in Wilke, Maxwell-Stefan rather than Wilke-Bonsaquet, Maxwell-Stefan and Dusty Gas Model.Regarding to pilot tests, in 2010 there were about 1500 EOR (i.e. Carabobo[44], Grosmont[45]etc.) of which 78% refers to sandstone, 18% to Carbonate and 4% to turbidite and offshore fields. Among EOR technologies thermal and chemical projects are widespread in sandstone while gas and water recovery in the rest.[46]One of the most interesting project concerns Bakken formation one of the biggest oil and gas reservoir in the USA. It is estimated that this geological formation could yields until 40 billion barrels[47], but only 10% is nowadays recovered due to low permeability (0.0018-0.0036 mD).[48] Therefore from 2008 to 2014 seven pilot tests are performed to improve oil recovery: 2 in Montana and 5 in North Dakota. Several techniques are used: cyclical injection with CO2 and water, flooding with water and enriched natural gas and vertical injection with CO2. Despite ultra-low permeability emerges that injectivity doesn’t be an issue for either gas or water. However, increasing in oil recovery is low. Therefore, new tests need to be performed to understand fractured networks, flow in nanopores rocks and collect more data. This can be achieved by means of cores from vertical and later section subsequently analysed in laboratories. (for more information about pilot tests see[49]).

5.Energy Subsurface Storage

The most mature and widely used technology is the Underground Gas Storage (UGS). Nowadays, indeed, there are 630 underground gas storages[50]. The gas is injected, from the pipeline to the ground such as depleted oil reservoirs when the demand is low and is used when the demand grows. The storages don’t have 100% efficiency because part of the gas called “cushion gas” remains in the subsurface to maintain pressurized the reservoir.[51] A promising technology is the Carbon Capture Storage (CCS)of CO2 where the gas injected in the subsurface can work as a displacing fluid (see Section Gas Enhanced Oil Recovery) or can be stored. Generally, it is injected at a depth of about 800 m where CO2 is in a liquid or supercritical state. It can be stored by a “cap rock” such as clay rock that is impermeable to CO2 or by capillary forces that block the CO2 in pores.[52]


fig.6

Figure 6 – Applications of Carbon Capture Storages.[52]


6. Conclusions

Nowadays technologies to Enhanced Oil Recovery of unconventional hydrocarbons and Energy Storages exist. The most widespread are TEOR (ThermalEnhanced Technology) and Underground Gas Storage but they don’t achieve high efficiency.

Several mathematical models are used to describe the flow in porous rocks. However, porous media have a chaotic configuration and the equation of transport can be resolved analytically only in few cases. Furthermore, the models are based on simplified hypothesis that allow to describe a specific phenomenon. Therefore, is necessaryto continue investigating the hydrodynamics in nanopores rocks by means of pilot tests (i.e. Carabobo, Grosmont, Bakken etc.) In this way is possible to improve technologies and models that allow to describe the phenomena exhaustively.Among emerging technologies, nanoparticles (i.e. silica, CNT etc.) can be a pivotal role in increasing oil recovery. However, these compounds are tested only on laboratory scales and are very expensive. Therefore, is necessary to reduce the cost of production by having better performances with lower concentration


[1]http://www.ogj.com/articles/2017/09/iea-revised-up-forecasts-of-global-oil-demand-growth.html
[2]https://www.repsol.energy/imagenes/global/en/SPE_unconventional%20resources_challenges%20and%20opportunities_the%20role%20of%20EOR_tcm14-46486.pdf
[3] http://www.unconventionalenergyresources.com/
[4]A. Muggeridge et al., Recovery rates, enhanced oil recovery and technological limits, Phil. Trans. R. Soc. A 372: 20120320. http://dx.doi.org/10.1098/rsta.2012.0320
[5]https://pangea.stanford.edu/ERE/pdf/pereports/PhD/Al-Ismail2016.pdf
[6] http://discovery.ucl.ac.uk/1467168/1/PhD_Thesis_Ho_revised_final.pdf
[7]A. Satter,G. M. Iqbal, Reservoir Engineering, The Fundamentals, Simulation, and Management of Conventional and Unconventional Recoveries,Gulf Professional Publishing 2016.
[8] https://prism.ucalgary.ca/bitstream/handle/11023/3835/ucalgary_2017_zhang_kai.pdf?sequence=1&isAllowed=y
[9] https://www.researchgate.net/figure/Transition-Zone-for-Convention-and-Tight-Oil-Reservoirs_fig1_282118891
[10] http://education.aapg.org/researchlauncher/borujeni.pdf
[11] https://link.springer.com/content/pdf/10.1007%2Fs40789-016-0155-9.pdf
[12] http://www.spe.org/dl/docs/2012/ozkan.pdf
[13]M.Sahimi, Flow and Transport in Porous Media and Fractured Rock: From Classical Methods to Modern Approaches, 2nd Edition, Wiley-VCH 2011.
[14]https://prism.ucalgary.ca/bitstream/handle/11023/3256/ucalgary_2016_fragoso_alfonso.pdf?sequence=1&isAllowed=y
[15]Nowadays these different technologies are grouped into two categories: IOR (Improved Oil Recovery) that includes secondary and tertiary recovery and EOR (Enhanced Oil Recovery) that includes only tertiary recovery.
[16] http://gaffney-cline-focus.com/optimal-design-pilot-tests-english
[17]https://www.petro-online.com/news/fuel-for-thought/13/breaking-news/what-is-the-difference-between-primary-secondary-amp-enhanced-recovery-for-oil-extraction/31405
[18]James G. Speight, Introduction to Enhanced Recovery Methods for Heavy Oil and Tar Sands, Gulf Professional Publishing, 2016.
[19] http://www.belgravecorp.com/steaminjection
[20]G. Chunsheng, NumericalSimulationofSteamInjectionfor HeavyOilThermalRecovery, Energy Procedia   2017, 105, pp 3936 – 3946.
[21] J. Alvarez and S.Han, Current Overview of Cyclic Steam Injection Process, Journal of Petroleum Science Research 2013, 2(3), pp 116-127.
[22] http://www.megenergy.com/operations/steam-assisted-gravity-drainage-sagd
[23] http://large.stanford.edu/courses/2010/ph240/bazargan1/
[24] N. Mahinpey, Insitu combustion in Enhanced Oil Recovery (EOR): a review, Chemical Engineering Comunications 2007, 194 (8), pp 995-1021.
[25] https://www.netl.doe.gov/file%20library/research/oil-gas/enhanced%20oil%20recovery/other/bwinsitu_comb.PDF
[26]https://www.netl.doe.gov/File%20Library/Research/Oil-Gas/publications/brochures/CO2-EOR-Primer-2017.pdf
[27] http://susris.com/2014/01/17/jadwa-outlook-for-unconventional-oil-gas-production/
[28] http://susris.com/wp-content/uploads//2014/01/figure12.jpg
[29]S. Kumar and A. Mandal, A comprehensive review on chemically enhanced water alternating gas/CO2 (CEWAG) injection for enhanced oil recovery,Journal of Petroleum Science and Engineering 2017, 157, pp 696-715.
[30]A. Thomas, Polymer Flooding, INTECH 2016. http://dx.doi.org/10.5772/64623
[31]J.J.Sheng, Status of Surfactant EOR Technology, Petroleum 2015, 1(2), pp 97-105.
[32] https://www.netl.doe.gov/file%20library/research/oil-gas/enhanced%20oil%20recovery/other/bwalkaline.PDF
[33]https://www.spgindia.org/2010/029.pdf
[34] https://www.sciencedirect.com/science/article/pii/S240565611630102X
[35] https://www.onepetro.org/journal-paper/SPE-171539-PA
[36] https://www.sciencedirect.com/science/article/pii/S2405656116301134#bib45
[37] https://ars.els-cdn.com/content/image/1-s2.0-S2405656116301134-gr11_lrg.jpg
[38] https://www.ncbi.nlm.nih.gov/pmc/articles/PMC4913300/pdf/srep28128.pdf
[39] https://ogst.ifpenergiesnouvelles.fr/articles/ogst/pdf/2016/04/ogst150109.pdf
[40] https://www.ncbi.nlm.nih.gov/pmc/articles/PMC4919511/pdf/ncomms11890.pdf
[41] http://www.nature.com/articles/ncomms11890/figures/2
[42] https://link.springer.com/content/pdf/10.1007/s13202-017-0382-7.pdf
[43] https://www.comsol.com/paper/download/194725/prajapati_paper.pdf
[44] http://www.searchanddiscovery.com/documents/2013/20205villarroel/ndx_villarroel.pdf
[45] http://large.stanford.edu/courses/2012/ph240/lagasca2/
[46] http://www.spe.org/dl/docs/2011/Bondor.pdf
[47] https://bakkenshale.com/
[48] http://www.searchanddiscovery.com/pdfz/documents/2017/80606hoffman/ndx_hoffman.pdf.html
[49] https://www.onepetro.org/conference-paper/SPE-180270-MS
[50] C. Gniese, Relevance of Deep-Subsurface Microbiology for Underground Gas Storage and Geothermal Energy
Production, Adv BiochemEngBiotechnol 2014, 142, pp 95-121.
[51] B.M. Freifeld et al., Well Integrity for Natural Gas Storage in Depleted Reservoirs and Aquifers, DOE National Laboratories Well Integrity Work Group, 2016.
[52]https://www.ipcc.ch/pdf/special-reports/srccs/srccs_technicalsummary.pdf


Latest Advancements in Process Control in Refineries and Chemical Plants


Author: Giovanni Franchi-Chemical Engineer – PhD Student –University UCBM – Rome (Italy)


1.Theme Description

The world production of chemicals in 2020 will increase of 144 Million of metric tons[1] with a market of 4.650 US$ billion.[2] Automation and Process Control have a pivotal role in industrial plants, indeed, they allow to improve products quality, plants efficiency, the safety and reliability of the processes.

The automatic feedback controls were introduced in 1920-1930s mounted on the controlled equipment. Since then, process control has spread rapidly from the first digital devices at the end of 1950s up to Programmable Logic Controllers (PLCs) and Distributed Control System (DCS) in 1970s.Nowadays networks of computers manipulate thousands of variables, but 85-95% of feedback control loops are based on Proportional-Integrative-Derivative (PID) system developed in 1930s. Furthermore, the flow rates of liquid and gases are controlled by pneumatic valves.[3]

The use of advanced controls can increase plant’s profit margin between 10-20% and reduce emissions of about 70%[4].Therefore, in the following sections PID tuning optimization, APC (Advanced Process Control) and MPC (Model Predictive Control) are described. Finally, an overview on the latest software in process control and “smart control” are discussed.


2. Process Control

The Aspen Technology Inc. has defined five levels of maturity for a refinery and chemical plant depending on the control level, from level zero where no process simulation is used up to level four, where several models are reported in a single flowsheet and engineers can make decisions by monitoring key parameters.[5] As can be seen in Figure 1, a plant, usually runs in a safety zone called “comfort zone” away from constrain limits. With PID optimization and APC is possible to reduce from three to ten times the amplitude of oscillations working near constrain limits and increasing productivity and profit margins.[6]

Comfort zone and pOsitive Effects

Figure 1 – “Comfort Zone” and Positive Effects by using PID tuning optimization and APC.6

Therefore, in this section PID tuning optimization and APC controls are described.


PID Controls

The PID controls are the most common control used into chemical and petrochemical plants due to easy implementation and robustness. (Figure 2)

The controller takes a corrective action depending on the magnitude of the error[7]:

  • proportional action cuts off most of the errors;
  • integral action reduces steady-state error or off-set;
  • derivative action decreases maximum overshoot.


PID control loop

Figure 2 – PID control loop.[8]


In order to have desirable outputs it can be used a separate controller for each variable (decentralized strategy) or a single controller that manipulate all the variables (centralized strategy)3.It is usually used in parallel form expressed as follow:

Where,= bias (steady-state) value; Kc = controller gain; e(t) = error signal set equal to (set point – present value); τI = integral time or set time; τD = derivative time.

Tuning Optimization

There are several tuning techniques that allow to find proper PID parameters.

These methods were developed since 1940s and nowadays can be divided into two categories: Classical and Artificial Intelligent methods.

Classical methods include: Ziegler and Nichols and Cohen and Coon Methods. Ziegler and Nichols proposed two methods, the first called “step response” that can be applied only to open-loop stable plants. It considerers, indeed, the response of industrial process such as a S-shape without overshoot. As can be seen in Figure 3,the delay time (L) represents the intersection of tangent line at inflection point of the curve and x-axes. While time constant (T) represents the intersection with steady state line. From these values is possible to find PID parameters.

Parameters of the First Ziegel Nichols Meth

Figure 3 – Parameters of the First Ziegler Nichols Method.[9]


The second method is called “continuous cycling method”. It allows to find the critical frequency of the system by increasing the proportional gain until stability limit. The two parameters that describe the response of the system are KCU(ultimate gain) and PU(ultimate period). In Table 1 are shown the relationship between PID parameters and the two Ziegler and Nichols methods.


tab1
Table 1–Parameters of the Step Response and Continuous Cycling Method.[10],[11]


Ziegler and Nichols methods are suitable for level control but not for flow, liquid pressure that require a rapid response.[12]In these cases Cohen and Coon methods are used.[13]This method finds three poles: two complex and one real that allow to minimize the integrated error and to have a decay ratio of about ¼.[14]

Artificial Intelligent Methods include dozens of methods. Some of them are described, such as Genetic and Differential Evolution Algorithms. For the other ones such as Simulated Annealing (SA), fuzzy system, Artificial Bee Colony (ABC), Particle Swarm Optimization (PSO) etc. it can be consult references[15],[16]  .

Genetic Algorithm starts from a random population of binary strings called chromosomes each of them represent the solutions of the problem. The strings are encoded to real number that defines PID parameters. These values are elaborated by PID controller and the response is evaluated by means of objective function such as MSE (Mean Square Error), IAE (Integral Absolute Error), ISE (Integral Squared Error) etc. The fitness values are subjected to a process of selection, crossover and mutation until best fitness is obtained.[17]

Flow chart of Genetic Algorithm

Figure 4 – Flow chart of Genetic Algorithm.[18]


Differential Evolution Algorithm, instead, starts from the initialization of real encoding matrix where rows represent PID parameter while columns represent i-th population vector. Each population is evaluated by PID controller and the result represent the fitness value. Then crossover step that involves target vector (first vector of population)and mutual vector (three random vectors from population are selected) generates a trial vector whom fitness values are elaborated by PID. Finally, fitness values of target vector and trial vector are compared to select the minimum value. In this way the individual of new population is generated. The algorithm stops when new population is completed.

Flow Chart of Differential Evolution

Figure 5 – Flow Chart of Differential Evolution.[19]


The main limit of feedback control is that corrective action takes place only when output is perturbed from its set point. Therefore, more advanced controls were developed such as PID plus feed forward that allows to intervene before disturbance takes place or cascade composed by two controllers, two sensors and one actuator acting on two processes in series.[20]Despite PID controllers ensure good stability and suppression of the disturbances, process performance optimization fails due to the multivariable nature of it and the complex interactions between controlled variables. Therefore, Advanced Process Control are necessary.[21]

3. APC

The APC includes all software that allows to control critical variables and predicts quality in real-time such as:

  • Statistical Process Control (SPC)that uses a random sampling and statistical analysis to identify causes outside the process that changed the quality of a product. This method is used especially for manufacturing lines, but it fits well also process where output can be measured. [22]
  • Run2Run (R2R) is widespread in the semiconductor industry (for more information see Moyene et al.[23]), but it can be applied also to batch processes such as chemical vapor deposition or batch chemical reactors10. The quality of the product is evaluated at the end of the run and the set-points are changed between two successive runs. Therefore, this control is used when there aren’t enough on-line measurements of the interest products.
  • Model Predictive Control (MPC) described more in detail later.

An example of APC implementation is described by Howes et al.6 for a lubrification of oil process. The system consists of 12 manipulated variables, 28 controlled variables and 11 feedforward controls. By means of Pitops software developed by Pi Control the plant has increased rate of production of 5% saving about 1.3 M€. The software, indeed, gives the parameters of the system in 10 minutes basing on historical data without step tests. Other examples are Canada’s Yara Belle PlaineInc. and South Korea’s LG Petrochemical Corp. The first applied APC techniques to a nitric acid plant reducing methane emissions by 25% maintaining high temperature combustion. While the latter, applied to a naphtha cracking, allows to improve yield by 5%, reducing energy consumption in cold side by 8% and saving 100.000 $/y.[24]

MPC

The precursor of MPC is represented by LQG (Linear Quadratic Gaussian) developed by Kalman in 1960s, but the first MPC generation appeared in 1970s with IDCOM (developed within ADERSA) and DMC (developed within Shell Oil). Nowadays we have reached the fifth generation where Honeywell, AspenTech and Shell dominate the markets[25]. The MPC is suitable to describe the behaviour of MIMO (Multi-Input, Multi-Output) processes.

As can be seen in Figure 6 a classical plant control provides for different hierarchical levels[26]: a plant wide-optimization, a local economic optimizer and a dynamic constraint control. Usually this is done by several PID controls lead-lag (L/L) blocks and high/low select logic. With MPC, shown in more detail on the right end, this can be achieved with better results by taking an action on the difference between actual and predictive value (residuals).11 ue (residuals).11

Comparison between a PID and MPC controller

Figure 6–Comparison between a PID and MPC controllers.[27],[28]


Commercial MPC software

Nowadays the main MPC software includes: DMCplus developed by AspenTech, SMOC of Shell Global and RMPCT of Honeywell. The following is a brief description of these, for more details see Lahiri[29].

DMCplus derives by the fusion of Dynamic Matrix Control (DCM) and Setpoint Multivariable Control Architecture (SCMA). The software is composed by several packages and allows to simulate Finite Impulse Response (FIR), linear Multi-Input, Multi-Output (MIMO) and nonlinear Multi-Input, Single Output (MISO) State Place. Recently AspenTech has introduced the Adaptive Process Control that reduces the possibility to have “flipping” behaviour of the plants due to the difference between the plant and the controller model. This package, indeed, forced the system to work in an optimum area instead of optimum setpoint. In this way, the performances of the plants aren’t compromised. The model, also, is implemented by using historical data of the process and adjusting online the parameters with an adaptive model, saving time.

SMOChas been used in more than 430 applications such as crude distillation, hydrocracking, styrene etc.

 It includes several packages:

  • AIDAprois an offline software that analyzes data from open and closed loop defining the mathematical model to be used by taking into account unmeasured disturbances.
  • MDprois an offline software that allows to control base and multivariable control loops by means of statistical methods.
  • RQEprousesa Kalman filter that allows to adapt the model on process conditions. It gives parameters for online process reducing maintenance and increasing stability of it.
  • SMOCprois used for multivariable control system optimization. This package uses a grey-box approach where input and output are defined by means of intermediate variables. In this way the engineers can take a cascade correction optimizing the response of the process.


RMPCT manages process with huge errors and large interactions between controlled variables. The controller doesn’t follow a specific trajectory but can move through any trajectory within the constrains defined by a “funnel”. At the same time, the controlled variables aren’t forced to keep the set points, but can change in a range. In this way disturbances are rejected and the control is optimized.


Smart Control

In the era of digital devices, “smart control” for chemical and petrochemical industry can have a key role in reducing costs, saving materials and increasing production rates. The idea is to create intelligent networks where flowsheet and variables are optimized in real time.[30] Emerson represents the leading company in the sector providing smart solutions both for old and new refinery such as electronic marshalling and HART (Highway Automated Remote Transducer) protocol. The former allows to eliminate cross-wires, to reduce the space occupied and the time for add new I/O interfaces[31]; the HART protocol, instead, matches the characteristics of analog and control system removing repetitive problem and predicting unexpected failures.[32] Several companies have implemented smart controls such as Chevron/PDVSA in Petropiar refinery saving 70 M$ in two years, reducing by 40% cost for pre-commissioning and commissioning, and 60% the losses due to instruments faults.[33] In China, Sinopec launched four pilot plants (Jiujiang, Zhenhai, Maoming, and Yanshan) using advanced control and online optimization. This allowed to increase profits of about 10% (i.e. at Yanshan and at Maomingprofits increased of 25.12 million of CNY and 41.94 million of CNY respectively).30

4.Conclusion

Process Control is very common in refineries and chemical plants. It was used for the first time in 1920-1930s and today is essential to respect product quality, safety and reliability of the processes. Despite the progress of technologies, 85-95% of feedback control loops are based on PID controllers and the main system controls are dated in 1985. The value of technologies that has reached the end-life and with more than 20 years is about 65US$ billion dollars and 53 US$ billion dollars respectively.33 Therefore, several tuning optimizations such as Artificial Intelligent Methods (Genetic and Differential Evolution Algorithms) together with Advanced Process Control (APC) have been described. Furthermore, some examples of the advantages offered by the implementation of APC have been shown and the latest software for Model Predictive Control (MPC) have been illustrated such as DMCplus, SMOC and RMPCT. In this scenario the “smart control” in chemical and petrochemical plants can have a pivotal role in reducing costs increase profits and create safer plants.  The current estimate provides that plant’s profit margin can improve of about 10-20% while emissions can decrease of about 70%.


[1] http://c.ymcdn.com/sites/www.vma.org/resource/resmgr/2016_mow_presentations/MOW_2016_-_Eramco.pdf
[2] http://www.ey.com/Publication/vwLUAssets/ey-chemicals-trends-analyzer/$File/ey-chemicals-trends-analyzer-may-2017.pdf
[3] https://chemengr.ucsb.edu/~ceweb/faculty/seborg/pdfs/EOLSS_rev%202_5_03.pdf
[4] http://ieeecss.org/sites/ieeecss.org/files/documents/IoCT-Part1-02ProcessIndustries.pdf
[5] S. R. Mohan, Five Best Practice for Refineries: Maximizing Profit Margins Through Process Engineering, Aspen Technology, 2016.
[6] https://hrcak.srce.hr/index.php?show=clanak&id_clanak_jezik=186465
[7] https://www.sciencedirect.com/science/article/pii/S1665642315000358
[8] https://www.pidtuning.net/pid-loop.php
[9] https://www.researchgate.net/figure/Response-curve-for-Ziegler-Nichols-method_261335802
[10] http://faculty.mercer.edu/jenkins_he/documents/TuningforPIDControllers.pdf
[11]D. E. Seborg, ProcessDynamics and Control, Fourth Edition, Wiley 2016.
[12] https://www.controleng.com/single-article/tuning-pid-control-loops-for-fast-response/495b3c78823d6ccfa58f2f83d58dc85c.html
[13] https://www.dataforth.com/tuning-control-loops-for-fast-response.aspx
[14]A. Datta, Advances in Industrial Control: Structure and Synthesis of PID Controllers, Springer-Verlag London 2000.
[15] https://www.ncbi.nlm.nih.gov/pmc/articles/PMC4703544/
[16] https://www.researchgate.net/publication/316990192_PID_Controller_Tuning_Techniques_A_Review
[17]https://www.researchgate.net/publication/261988190_Implementation_of_PID_Controller_Tuning_Using_Differential_Evolution_and_Genetic_Algorithms
[18] https://www.researchgate.net/figure/303541914_Figure-2-Flowchart-of-genetic-algorithm-for-PID-tuning
[19] https://www.researchgate.net/figure/277924285_Block-diagram-of-proportional-integral-derivative-tuning-using-differential-evolution
[20] https://www.sciencedirect.com/science/article/pii/S1665642315000358#fig0010
[21]Lahiri, S. K. (2017) Introduction of Model Predictive Control, in Multivariable Predictive Control: Applications in Industry, John Wiley & Sons, Ltd, Chichester, UK. doi: 10.1002/9781119243434.ch1
[22]B.R. Mehta and Y. J. Reddy, Industrial Process Automation Systems: Design and Implementation, Butterworth-Heinemann 2014.
[23] J. Moyne et al., Run-to-Run Control in Semiconductor Manufacturing, CRC Press LCC, 2001.
[24] https://www.chemicalprocessing.com/articles/2015/overcome-fear-of-advanced-process-control/?show=all
[25]Lahiri, S. K. (2017),Historical Development of Different MPC Technology, in Multivariable Predictive Control: Applications in Industry, John Wiley & Sons, Ltd, Chichester, UK. doi: 10.1002/9781119243434.ch3
[26] S. Joe Qin, A survey of industrial model predictive control technology, Control Engineering Practice, 11,pp 733–764, 2003.
[27] http://www.sciencedirect.com/science/article/pii/S0967066102001867
[28]http://folk.ntnu.no/skoge/vgprosessregulering/papers-pensum/seborg-c20ModelPredictiveControl.pdf
[29]Lahiri, S. K. (2017) Commercial MPC Vendors and Applications, in Multivariable Predictive Control: Applications in Industry, John Wiley & Sons, Ltd, Chichester, UK. doi: 10.1002/9781119243434.ch16
[30] https://www.sciencedirect.com/science/article/pii/S2095809917302977
[31] https://www.emerson.com/documents/automation/electronic-marshalling-overview-en-57838.pdf
[32] https://www.plantservices.com/assets/Media/1003/WP_HART_Instrumentation.pdf
[33]http://www2.emersonprocess.com/siteadmincenter/PM%20Articles/SmartRefinerySupplement_Sept2010_Final.pdf


Practice and Technology and Measures For Improving Energy Efficiency in the Chemical and Petrochemical Sector

Author: Giovanni Franchi-Chemical Engineer – PhD Student –University UCBM – Rome (Italy)


1.Theme Description

Energy use grew up from 4.6 Mtoe[1] in 1973 to 13.4 Mtoe in 2012.Total final energy consumption decreased in Europe while it increased in non-OECD countries, reaching a further 1.3% in 2014 (i.e China 3.1% and 4.3% in India).[2],[3]

Figure 1 shows World Energy consumption for OECD and Non-OECD country from 1990 to 2040. As can be seen from 2010 up to 2040, it will grow of 56% from 524 quadrillion of BTU to 820 quadrillion of BTU. The industrial sector will consume more than 50% of the energy in 2040 and this energy will be produced for 80% from fossil fuel.

fig.01


Figure 1World Energy Consumption from 1990 up to 2040.[4]

In this scenario Chemical and Petrochemical sectors contribute to a large part of the Industry energy consumption (~ 30% including feedstocks)[5]. Therefore, in the following section, Best Practice Technologies (BPT) that allow to save energy and reduce COemissions are described.


2.Energy Consumption in Chemical and Petrochemical Sectors


The energy consumption from Industry reached 29% of final energy consumption in 2012 and Chemical and Petrochemical sectors are the largest energy users with 35 EJ[6] (see Figure 2), contributing to about 7% of the global CO2 emissions.[7]


fig.02


Figure 2 – Energy consumption by sector (figure 1) and Industrial Energy Consumption by sector (figure 2) (2)


The main energy consuming processes are steam cracking, ammonia production from natural gas and coal, extraction of aromatics, methanol and butylene that accounts for about 70% of the consuming.5

The energy efficiency in these sectors has been started since 1970s after oil crisis.

Table 1 and Table 2 show some of the possible measures to increase energy efficiency. In particular, Table 1 refers to the main equipment used in the processes,while Table 2 refers the production of specific chemical compounds.


 Equipment, Steam Distribution and 

 Controls 

 Measures to increase Energy Efficiency
 Boiler
  • Pretreatment of boiler feed water.
  • Flue gas analyzer (it improves efficiency and reduce NOx).
  • Reduce flue gas amount due to leaks in the boiler.
  • Reduce excess air.
  • Improve insulation.
  • Maintenance (i.e. antifouling and antiscaling).
  • Recover heat (i.e. flue gas and blowdown).
 HeatExchanger
  • Fouling prevention by means of temperature control, regular maintenance and cleaning, inhibitors and surface coating.
 Steam Distribution
  • Insulation (low thermal conductivity, resistance to water adsorption, combustion and temperature change).
  • Steam trap (i.e. maintenance, recovery flash steam).
  • Recovery of hot condensate.
 Electric Motors

(pump, compressor and fun)

  • Follow standard of NEMA (USA) or IEC (EU).
  • Use variable speed drivers.
  • Pump/motor alignment check.
  • Correct size.
  • Use multiple pumps.
  • Replace V-belts with cog belts.
  • Keep motors and compressor lubricated and cleaning.
  • Use filter to prevent entry of contaminants.
 Distillation
  • Optimize the reflux ratio.
  • Reduce purity when is not necessary in this way the reboiler duty decreases.
  • Replace trays with new ones.
  • Replace old column with Divided Wall and Heat Integrated columns.
 Control system
  • Mathematical (“rule-based”).
  • Neural Network (“fuzzy-logic”).
  • Artificial Intelligent.


Table 1 – Methods to Improve Energy Efficiency by referring to specific equipment (for more detail see[8],[9]).


 Chemical Compounds Production  Measures to increase Energy Efficiency
 Ethylene
  • Sulphur-based inhibitor (reduce coke formation in the coil).
  • Improve furnace coils (i.e. ceramic or ceramic coated).
  • Integration with a gas turbine.
  • Use of high-temperature quench oil towers.
  • Reduce pressure drop in compressor inter-stage.
 Aromatics
  • Improve energy recovery.
 Polymers
  • Use power and steam from cogeneration.
  • Production of low pression steam (i.e. using exothermic heat of the reaction).
  • Gear pump and/or extruder.
  • Re-use of solvent, oils and catalysts.
 Styrene
  • Use of steam condensate instead of low pressure steam.


Table 2 – Methods to Improve Energy Efficiency by referring to specific compounds (for more detail see 8).


2.1 Applications of Emerging Technologies

The main chemical and petrochemical processes (i.e. steam cracking, ammonia production etc.) use catalysts to enhance the velocity of specific reaction increasing the yield. The IEA in collaboration with International Council of Chemical Association (ICCA) and DECHEMA estimated that improvement of catalysts and related processes could reduce energy consumption of 20-40% in 2050.[10]

Recently new processes have been developed to produce these compounds at lower costs:

  • Methanol to Olefin (MTO), uses synthetic gas instead of crude oil. UOP and Norsk Hydro (now Ineos) developed a MTO process that allows to increase the yield of ethylene and propylene reducing by-product and catalyst consumption.[11]This process has been tested at semi-commercial scale by Total Petrochemical in Belgium.
  • Hydrogen Peroxide Propylene Oxide (HPPO), produces propylene oxide by the reaction of hydrogen peroxide and propylene. The process saves about 10-12% of energy (included hydrogen peroxide production) compared to conventional processes10 avoiding by-products such as propylene dichloride and styrene monomer. One of the biggest commercial plant (300,000 t/year) is in Belgium based on BASF/Dow chemical technologies.[12]
  • Gas to Liquids (GTL),where natural gas is converted into liquid fuels such as naphtha, kerosene, diesel etc.[13] Nowadays there are five commercial plants developed by Shell (Malaysia and Qatar), Sasol (South Africa) and joint venture between Sasol and Chevron (Qatar). These plants have a capacity between 2,700 bbl/d up to 140,000 bbl/d and high investment costs[14] (i.e. Shell cancelled a plant in Louisiana due to the jump of the price from 12.5 to over 20 B$[15]). Therefore recently, small GTL plant shave tested. A commercial plant was realized in Brazil by Petrobras and CGTL. It produces 200,000 scf/d and it costed 45US$.[16]


2.2 Indices to evaluate Best Practice Technologies (BPT)

Nowadays two terms are used to group the most efficient technologies used in the processes:

  • BPT, means Best Available Technologies and refers to most advanced technologies economically available at industrial scale.
  • BAT, stands for Best Available Technologies more technologically advanced, but not always economically suitable.

In some cases, the two terms coincide. In the chemical and petrochemical sectors usually refer to BPT.5,[17]

The International Energy Agency (IEA) in the reporton: “Chemical and Petrochemical: Potential of Best Practice Technology and other measures for improving energy efficiencies” has defined two different indices for Energy Efficiency and CO2 savings.

The former is the ratio between the sum of the minimum energy associated to each process and total energy use by chemical and petrochemical processes (Table 3). The last takes into account only direct emissions excluding that related to electricity, use and waste treatments (Table 4).

The value of both indices is function of the approach used. In both top-down and bottom-up approaches the energy efficiency is the ratio the potential performance of the sector under BTP and the current performance. However, in the top-down approach the BPT values are scaled by a coverage factor set equal to 0.95 for all country. While for bottom-up approach this value is specific for each country. The coverage factor takes into account that not all processes are considered. In the table 3 are shown the results for 57 processes and 66 chemical products. Considering electricity, the improvement potentials reaches 20%.5

Country TFEU[18]

[PJ/y]

(BPT)T-D[19]

[PJ/y]

(BPT)B-U[20]

[PJ/y]

(EEIj)T-D[21]

[%]

(EEIj)B-U[22]

[%]

IT-D[23]

[%]

IB-U[24]

[%]

USA 6412 4851 5713 75.6 89.1 24.4 10.9
China 4301 4459 3397 103.7 79.0 -3.7 21.0
Germany 1064 1048 931 98.5 87.5 1.5 12.5
India 1096 1113 893 101.5 81.4 -1.5 18.6
France 627 556 563 88.7 89.9 11.3 10.1
Italy 389 348 344 89.5 88.5 10.5 11.5
World 31,529 26,544 26,898 84.2 85.3 15.8 14.7

Table 3 – Improvement potentials of main Countries in 2006 (excluding electricity) (6)


The top-down approach underestimates the improving potential for China and India leading to a negative value. While bottom-up approach leads to coverage factor, for some country, more than 100%. Therefore, both methods have critical elements due to overestimation of the process. Indeed, heat cascading and co-generation are neglected.

 Country

 Direct CO2 Emissions

 [Mt CO2/y]

 (CO2)index-mix[25]  (CO2)index-NG[26]
T-D

[%]

B-U

[%]

T-D

[%]

B-U

[%]

 USA 278 0.63 0.81 0.51 0.67
 China 148 1.03 0.50 0.47 0.07
 Japan 111 0.80 0.87 0.53 0.59
 Germany 42 0.95 0.74 0.63 0.46
 France 27 0.79 0.80 0.52 0.53
 Italy 12 0.73 0.70 0.43 0.40
 World 1,255 0.65 0.66 0.50 0.51


Table 4 – CO2 savings for main countries in 2006 (5)


The CO2 savings is equal to:

  • 20-37% with the actual fuel mix and 37-57% with natural gas, for a top-down approach;
  • 19-50% with actual fuel mix and 33-60% (excluding China) with natural gas for a bottom-up approach.

Finally, in the figure 3 is shown the energy saving potential with BPT and other options such as co-generation, recycling, energy recovery etc.For chemical and petrochemical sectors, the energy saving potential with BPT amount to 120-150 Mtoe/year and 370-470 MtCO2/year.7

fig.03

Figure 3 – Comparison between energy saving potential.[27]


3.Conclusions

The Chemical and Petrochemical sectors are the largest energy users within industrial sector and they reached 30% of final consumption in 2012. There are several measures to improve energy efficiencies (Table 1 and Table 2) and some of emerging processes are Methanol to Olefin (MTO), Hydrogen Peroxide Propylene Oxide (HPPO) and Gas to Liquid (GTL). The International Energy Agency (IEA) has defined two indices to evaluate the Energy Efficiencies and CO2 potential savings by applying Best Practice Technologies (BPT). This term groups the most advanced technologies economically available at industrial scale. The value of these indices depends on the approach used: top-down or bottom-up. The two methods lead to different results but both in some cases overestimate or underestimate the improvement potential. Therefore, it is necessary to consider more data and associate BPT with co-generation, recycling energy and the use of biomass feedstocks. IEA in collaboration with International Council of Chemical Association (ICCA) and DECHEMA, also, define four pathways to be followed in the future: improve feedstock energy (i.e. production of synthetic gas from several raw material), fuel form gas and coal, New routes to polymer (i.e. saccharification of lignocellulose into bioethanol) and hydrogen production (i.e. from biomass, waste material, improve of water electrolysis etc.).[28]


[1]Mtoe = Million tonnes of equivalent Oil.
[2]S. Fawkes et al., Best Practice and Case Studies for Industrial Energy Efficiency Improvement, An Introduction for Policy Makers, Copenhagen Centre of Energy Efficiency, 2016.
[3] https://www.iea.org/etp/tracking2017/industry/
[4] https://www.eia.gov/todayinenergy/detail.php?id=12251
[5]D. Saygin et al.,Chemical and Petrochemical Sector: Potential of best practice technology and other measures for improving energy efficiency, OECD/IEA, 2009.
[6]D. Saygin et al., Potential of best practice technology to improve energy efficiency in the global chemical and petrochemical sector, Energy 2011, 36, pp 5779-5790.
[7]M. Hagemann et al.,Development of sectoral indicators for determining potential decarbonization opportunity, Ecofys and Institute of Energy Economics, Japan 2015.
[8]Maarten Neelis et al., Energy Efficiency Improvement and Cost Saving Opportunities for the Petrochemical industry, An ENERGY STAR®Guide for Energy and Plant Managers, Energy Analysis Department Environmental Energy Technologies Division Ernest Orlando Lawrence Berkeley National Laboratory University of California, 2008.
[9]Yeen Chan et al., Study on Energy Efficiency and Energy Saving Potential in Industry and on Possible Policy Mechanisms, ICF International, 2015.
[10]http://www.iea.org/publications/freepublications/publication/Chemical_Roadmap_2013_Final_WEB.pdf
[11] https://www.uop.com/processing-solutions/petrochemicals/olefins/#ethylene
[12] http://www.chemicals-technology.com/projects/basf-hppo/
[13] http://petrowiki.org/Gas_to_liquids_(GTL)
[14] https://www.eia.gov/todayinenergy/detail.php?id=15071
[15] https://www.forbes.com/sites/peterdetwiler/2014/03/28/small-gas-to-liquids-plants-get-a-huge-boost/#73330c745419
[16]http://www.compactgtl.com/technology/petrobas/
[17]https://www.iea.org/publications/freepublications/publication/IEA_EnergyEfficiencyIndicators_EssentialsforPolicyMaking.pdf
[18]TFEU = actual total final fuel and steam use of a country reported in IEA energy statistics, including feedstocks;
[19](BPT)T-D= specific final energy consumption under Best Practice Technology for a Top-Down approach. This value is scaled according to coverage factor (to take into account that some processes have not been considered)assumed equal to 0.95.
[20](BPT)B-U= specific final energy consumption under Best Practice Technology for a Bottom-Upapproach. This value is scaled according to coverage factor set equal to: 0.82 for the USA, 1.26 for China, 1.20 for India, 1.08 for Germany, 0.95 for France and 0.97 for Italy.
[21](EEI)T-D = Energy Efficiencies Indicators for a Top-Downapproach.
[22](EEI)B-U = Energy Efficiencies Indicators for a Bottom-Up approach.
[23](I)T-D = Improvement Potential (1-(EEI)T-D) for a Top-Down approach.
[24](I)B-U= Improvement Potential (1-(EEI)B-U) for a Bottom-Up approach.
[25] (CO2)index-mixevaluates the CO2 saving under BPT by means of the same fuel mix in 2006. Referring for example to EU in 2014 fuel mix consist of: Electricity (56%), Gas (32%), Solid Fuel (5%), Total Petroleum Product (4%) and Other (3%). (ref. 9)
[26](CO2)NGevaluates the CO2 saving under BPT by means of natural gas.
[27] http://www.iea.org/publications/freepublications/publication/technology-roadmap-chemical-industry-via-catalytic-processes.html
[28] https://www.iea.org/media/freepublications/technologyroadmaps/TechnologyRoadmapCatalyticProcessesAnnexes.pdf