

Author: Vincenzo Piemonte, Associate Professor, University UCBM – Rome (Italy)
1.Theme description
The Life Cycle Assessment (LCA) allows to evaluate the interactions that a product or service has with the environment, considering its whole life cycle that includes the preproduction points (extraction and production of raw materials), production, distribution, use (including reuse and maintenance), recycling, and final disposal. So the objectives of the LCA are to evaluate the effects of the interactions between a product and the environment, and therefore the environmental impacts directly or indirectly caused by the use of a given product.

Figure 1 -Example of a product System for LCA
LCA can be conducted by assessing the environmental footprint of a product from raw materials to production (Cradle to gate), or to be extended to the whole product life cycle, including its disposal (Cradle to grave ). If the analysis is performed directly on the categories of environmental impact, such methodology is called “Mid-point approach“. A viable and valid alternative is represented by the “End-point approach “ or ” Damage-oriented approach“

Figure 2 – LCA structure
According to ISO 14040[1] and 14044[2], the LCA is achieved through four distinct phases:
- Goal and Scope.
- Life Cycle Inventory (LCI).
- Life Cycle Impact Assessment (LCIA)
- Interpretation (normalization and weighting)
2.LCA Phases
In the first phase, the goal and scope of study are formulated and specified in relation to the intended application. The object of study is described in terms of a socalled functional unit. Apart from describing the functional unit, the goal and scope should address the overall approach used to establish the system boundaries. The system boundary determines which unit processes are included in the LCA and must reflect the goal of the study.
The second phase ‘‘Inventory’’ involves data collection and modeling of the product system as well as description and verification of data. This phase encompasses all data related to environmental (e.g., CO2) and technical (e.g., intermediate chemicals) quantities for all relevant unit processes within the study boundaries that compose the product system. The data must be related to the functional unit defined in the goal and scope phase. The results of the inventory are a life cycle inventory (LCI), which provides information about all inputs and outputs in the form of elementary fluxes between the environment and all the unit processes involved in the study.
The third phase ‘‘Life Cycle Impact Assessment (LCIA)’’ is aimed to evaluate the contribution to impact categories such as global warming and acidification. The first step is termed characterization. Here, impact potentials are calculated based on the LCI results. The next steps are normalization and weighting, but these are both voluntary according the ISO standard. Normalization provides a basis for comparing different types of environmental impact categories (all impacts get the same unit). Weighting implies assigning a weighting factor to each impact category depending on the relative importance.
Issues such as choice, modelling and evaluation of impact categories can introduce subjectivity into the LCIA phase. Therefore, transparency is critical to the impact assessment to ensure that assumptions are clearly described and reported.

Figure 3 – Stages of an LCA
The LCIA addresses only the environmental issues that are specified in the goal and scope. Therefore, LCIA is not a complete assessment of all environmental issues of the product system under study. LCIA cannot always demonstrate significant differences between impact categories and the related indicator results of alternative product systems. This may be due to
- limited development of the characterization models, sensitivity analysis and uncertainty analysis for the LCIA phase,
- limitations of the LCI phase, such as setting the system boundary, that do not encompass all possible unit processes for a product system or do not include all inputs and outputs of every unit process, since there are cut-offs and data gaps,
- limitations of the LCI phase, such as inadequate LCI data quality which may, for instance, be caused by uncertainties or differences in allocation and aggregation procedures, and
- limitations in the collection of inventory data appropriate and representative for each impact category.
The last phase, named ‘‘interpretation,’’ is an analysis of the major contributions, sensitivity analysis, and uncertainty analysis. This stage leads to the conclusion whether the ambitions from the goal and scope can be met.
The interpretation should reflect the fact that the LCIA results are based on a relative approach, that they indicate potential environmental effects, and that they do not predict actual impacts on category endpoints, the exceeding of thresholds or safety margins or risks. The findings of this interpretation may take the form of conclusions and recommendations to decision-makers, consistent with the goal and scope of the study.
Life cycle interpretation is also intended to provide a readily understandable, complete and consistent presentation of the results of an LCA, in accordance with the goal and scope definition of the study.
The interpretation phase may involve the iterative process of reviewing and revising the scope of the LCA, as well as the nature and quality of the data collected in a way which is consistent with the defined goal.
The findings of the life cycle interpretation should reflect the results of the evaluation element.
3.LCA Methods and Softwares
The LCA analysis can be performed by using softwares (the most important and used are SimaPro[3], Boustead[4], Gabi[5]) which implements several LCA methodologies. Among these, the most used methods at mid point level are:
- CML 2001[6] that computes 10 impact categories (Abiotic Depletion, Acidification, Eutrophication Climate change – GWP100, Ozone Layer Depletion, Human Toxicity, Freshwater Ecotoxicity, Marine Ecotoxicity, Terrestrial Ecotoxicity, Photochemical Oxidation);
- Cumulative Energy Demand (CED)[7], generally used for the evaluation of the primary energy savings, which accounts for 6 impact categories (Non renewable, fossil; Non renewable, nuclear; Renewable, biomass; Renewable, wind, solar, geothermal; Renewable, water)
- Intergovernmental Panel on Climate Change (IPCC)[8] is used for the assessment of the Global Warming and is a typical single issue methodology.
As for the methods at end-point level (or damage level), one of the most interesting is the Eco-indicator 99[9]. This approach deals with 11 mid-point impact categories (Carcinogenesis, Respiratory Organics, Respiratoty Inorganics, Climate Change, Radiation, Ozone Layer, Ecotoxicity, Acidification/Eutrophication, Land Use, Minerals, Fossil Fuels) further aggregated into representative macro-categories of overall damage: Human Health, Ecosystem Quality and Resources. The impact categories from carcinogens to ozone layer are then normalized and grouped in the macrocategory (end-point level or damage level) ‘‘Human Health’’ that takes in to account the overall impact (damage) of the emissions associated to the product analyzed on the human health. The categories ecotoxicity, acidification/eutrophication, and land use are included in the macrocategory ‘‘Ecosystem Quality’’ that accounts for the overall damage on the environment, while the ‘‘minerals and fossil fuels’’ are grouped in the macrocategory ‘‘Resources’’ that accounts for the depletion of non renewable resources. The impact category indicator results that are calculated in the characterization step are directly added to form damage categories. Addition without weighting is justified, because all impact categories that refer to the same damage type (like damage to the Ecosystem Quality) have the same unit (for instance, PDF*m2yr; PDF, potentially disappeared fraction of plant species). This procedure can also be interpreted as grouping. The damage categories (and not the impact categories) are then normalized on an European level (damage caused by 1 European per year), mostly based on 1993 as base year, with some updates for the most important emissions.
4.Case Study: Produced Water Treatment
Due to its complex and polluting composition, norms regarding the discharge of produced water into the environment have gradually become more and more limiting and strict. The costs of appropriate produced water treatments amount to about 40 billion dollars per year and they weigh clearly on the price of final products. For this reason, it is necessary that the water can be reused after being treated, this is especially true in arid places where water is a valuable and precious asset. The aim of this case study is to highlight the importance of treating the produced water, and understand their environmental importance. The assessment includes the entire life cycle of the process: the extraction and processing of raw materials, manufacturing, transportation, distribution, use, reuse, recycling and disposal.
the LCA method is applied to the most important produced water treatments, by using as process simulator Gabi 6. The analysis and the comparison have been made in for the two cases:
- Reinjection + Primary treatments (see figure 4);
- Reinjection + All treatments (including secondary and tertiary treatments) (see figure 5);
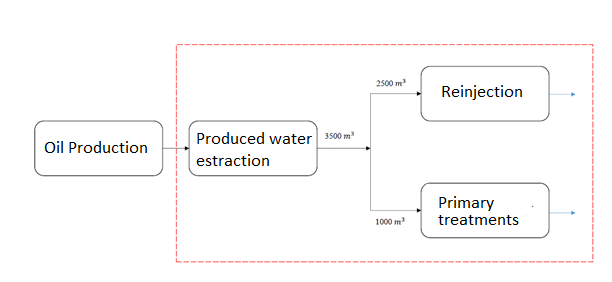
Figure 4 – Reinjection + Primary Treatments
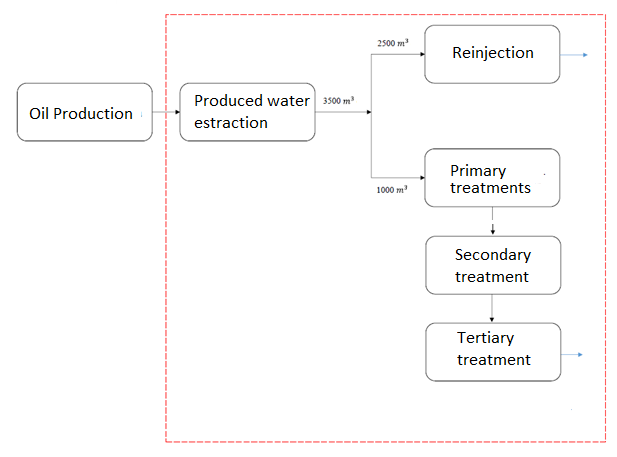
Figure 5 -Reinjection + All Treatments
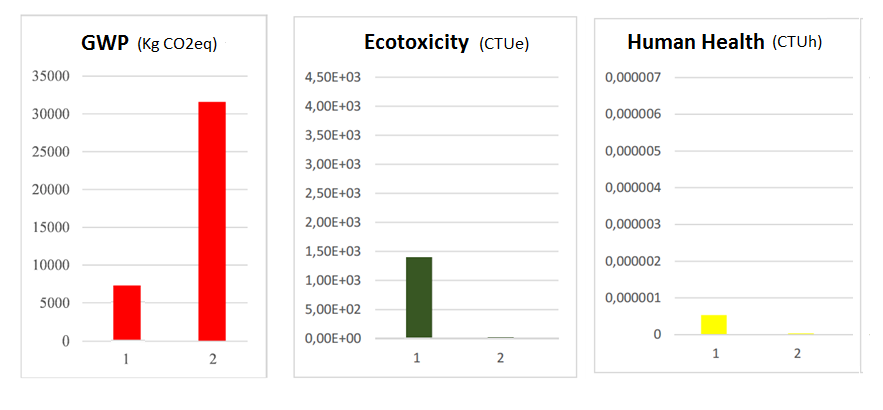
Figure 6 – LCA resut Comparison
Primary treatments accounts mainly of physical treatments aimed to the removal of suspended oil, while secondary treatments are focused on the removal f dissolved organic compoundes (mainly BTEX). The application of tertiary treatments (membranes) is necessary to make the produced water suitable not only for the disposal but to be used in civil and industrial fields. In this way it can represents a resource with economic value, rather than an oil extraction waste.
Figure 6 reports the LCA results comparison for the two systems under analysis in terms of three important impact categories of mid point level, which accounts for the global waming, the ecotoxicity and human health. As it can be see from the figure the presence of secondary and tertiary treatments strongly reduces the impact on ecotoxicity and human health, while the global warming effect is higher than that of system 1 (only primary systems) mainly due to incidence of GHG gases produced during the secondary and tertiary treatment processes.