Floating Storage Regasification Units (FSRU)
Author: Carlo Carniani – Senior Petroleum Engineer
LNG BASIC CONCEPTS
Natural gas is today a primary energy source, which will drive the transition from a fossil fuel-based to a renewable energy-based world.
In the past, oil companies drilled primarily for oil: they often had to reinject or flare the associated gas; on the other hand, a gas discovery was often considered not commercially valuable.
Later on, flaring was prohibited by producing countries, in a first instance for the sole purpose of saving mineral resources; more recently, reduction of greenhouse gases emissions became an important additional reason for avoiding flaring as much as possible.
On the other hand, gas turbine technology progress lead, in the ‘60s, to the manufacture of reliable equipment providing a large energy output. Such high efficiency gas turbines, generally known as combined cycle gas turbines (CCGT), made possible the realization of large size power generation units, opening the way for the extensive use of gas in power plants. The CCGT technology operates with a combination of Brayton and Rankine thermodynamic cycles and may reach a thermal efficiency of 64%, which is definitely a remarkable figure.
The occurrence of large natural gas reserves in remote locations and cost-effective ways of producing power from gas prompted companies to search for an alternative use for gas and liquefied natural gas (LNG) projects were conceived and evaluated. The balance between oil price (increasing) and production costs (decreasing) resulted in a progressively better economical feasibility for LNG initiatives. In addition to this, the search of secure and clean (compared to oil and coal) energy sources lead several countries to incentive the use of LNG. A typical example was the decision of UK to eliminate smog from urban areas, which was directly responsible for about 4,000 deaths per year, then switching to gas as the primary fuel for urban heating.
At the time this paper is written, geopolitical factors are increasingly pushing toward a very desirable energy independence for Europe. In this respect, LNG and natural gas supply from North Africa, Middle East and former Soviet Union countries are crucial for the EU energy balance. The former is the most flexible source among those available; EU countries are now expanding their capacity to import LNG from abroad.
Projects were undertaken on a case-by-case basis: buyers and sellers cooperated strictly on every aspect of the LNG value chain— production, liquefaction, transportation, and regasification. After the first deliveries in the ‘60s, LNG facilities grew progressively and became a significant global energy infrastructure in the present century, capable of providing a supply of 370 million tonnes of LNG per year.
LNG had a share of about 12% of the world gas production, according to IEA 2020 data. In the course of 2022 the global LNG trade increased by about 5% in the world, and the trend is expected to grow further as a result of Europe’s shift to massive LNG supply, as a consequence of the Russia-Ukraine conflict, and expected China’s increased energy demand.
EU is already the main LNG importer through 17 active terminals: at the end of 2022 second quarter, the amount of LNG was over 65 BCM, corresponding to a value exceeding 60 billions EUR. USA provided almost 50% of the total LNG imported by EU. The import capacity is presently 157 BCM of equivalent dry gas, that is, about 40% of the total gas demand. France, Spain and Belgium have been, in the order, the largest LNG importing countries so far.

TECHNICAL OUTLOOK
In simple terms, the LNG cycle consists in the following steps:
- identifying large reserves of natural gas with little or no chance of use in local markets,
- building a facility for liquefying the natural gas at very low temperatures (−163°C); this is because, in its liquid form, natural gas shrinks to less than 1/600th of its gaseous volume, making its transportation and storage possible over long distances.
- shipping the LNG in specially designed tankers to markets
- storing and regasifying LNG before injecting it into a pipeline grid.
At this point LNG becomes indistinguishable from pipeline gas for the end user. Floating regasification vessels come into play in the last step.
Approximately 8 to 10% of the energy in natural gas is consumed in the LNG liquefaction process and during LNG transport (LNG tankers use LNG as propulsive fuel). In a typical LNG liquefaction plant, it takes about 230 kW to liquefy one MMscfd of natural gas.
LIQUEFACTION PROCESS: TECHNOLOGY OVERVIEW
Natural gas purification and pre-treatment.
The natural gas feeding a liquefaction facility contains, in general, several contaminants that must be reduced to levels which meet:
- satisfactory liquefaction plant performance
- LNG sales specifications.
The level of each contaminant depends on the fluid properties and composition which are specific of each gas reservoir.
A typical pre-treatment process consists of the following steps.
First, any hydrocarbon condensates present in the natural
gas stream have to be separated. Such liquids are generally used as plant fuel, or resold.
Acid gas components (CO2, H2S) removal is then performed. CO2 levels must be contained within 50 parts per million (ppm), to avoid freezing in the main cryogenic exchanger. H2S content, instead, must be less than 3 ppm, to meet system integrity and sales gas specifications.
The removal of acid gases is accomplished by amine-based absorption processes. It is possible that amine- H2S reaction products have to be converted to elemental sulphur via a dedicated recovery unit (Claus process, catalytic oxydization), when the amount of H2S produced is relevant.
Feed gas undergoing acid components removal is bubbled through aqueous solutions; therefore, it exits the process train being saturated with water vapor, which has to be removed in order to avoid ice formation in the liquefaction exchanger.
Dehydration can be performed in a number of ways. A standard approach is absorption on glycol, which can be regenerated by distillation and used in a cycle.
An alternative dehydration scheme is achieved by cooling the gas with a heat exchanger fed with a proper pre-cooling fluid (air, water or other suitable fluid available), therefore condensing the major part of the water, while the rest is conveniently removed with molecular sieves that, thanks to the use of high surface area zeolites, may retain additional water till reaching levels below 0.1 ppm.
In certain cases, natural gas contains mercury, which must be removed at levels below 1 ppb. This is because mercury causes embrittlement of aluminium vessels and heat exchanger equipment, with potentially disastrous consequences, like those of the Skikda LNG plant accident occurred in 2004.
Effective mercury removal is accomplished by adsorption on a bed of molecular sieves or activated carbon; the latter can be impregnated with sulfur or halides, which form very stable solid compounds with mercury. The molecular sieves can also be regenerated, while the activated carbon beds cannot.
The final step in gas pre-treatment is the removal of those hydrocarbons which have a melting point higher or close to the methane boiling point, in order to prevent any solid formation by freezing in the cryogenic exchanger. In practice, the gas undergoes a series of distillations in columns designed to separate hydrocarbon fractions according to their increasing boiling point: therefore, there is a de-ethanizer column, followed by a de-propanizer and a de-butanizer columns. In this way, ethane, propane, butane and aromatics can be be removed from gas and used for several purposes: cooling fluid makeup, plant fuel or sold as NGL (natural gas liquids) products.
- Liquefaction processes. The natural gas liquefaction process consists, basically, in chilling the gas stream till it reaches the temperature of -163°C. This goal is achieved using a series of heat exchangers, where the gas is cooled down by a fluid that has been chilled down by expansion. The cool-down process is performed stepwise, using one or more working fluids. As it may be expected, such a process can be achieved in different ways, so several proprietary processes are marketed today for large-scale baseload natural gas liquefaction plants. These processes fall into the following broad categories:
- Pure-refrigerant cascade process, the basic one, where a single working fluid is used
- Mixed-refrigerant processes: in this case, a mixture of working fluids is used (e.g., propane and ethane) whose relative proportions can be adjusted to optimize the thermal efficiency in response to large external temperature variations.
- Nitrogen expander-based processes. This class of processes is often used in offshore facilities, because of the smaller footprint and the use of a not-inflammable working fluid, such as nitrogen.
- Propane-precooled mixed-refrigerant, with back-end nitrogen expander cycle. In this case, the refrigerant mixture is first cooled down using propane as working fluid, so that it can bring the feed gas close to the desired temperature; further cooling using nitrogen completes the process.
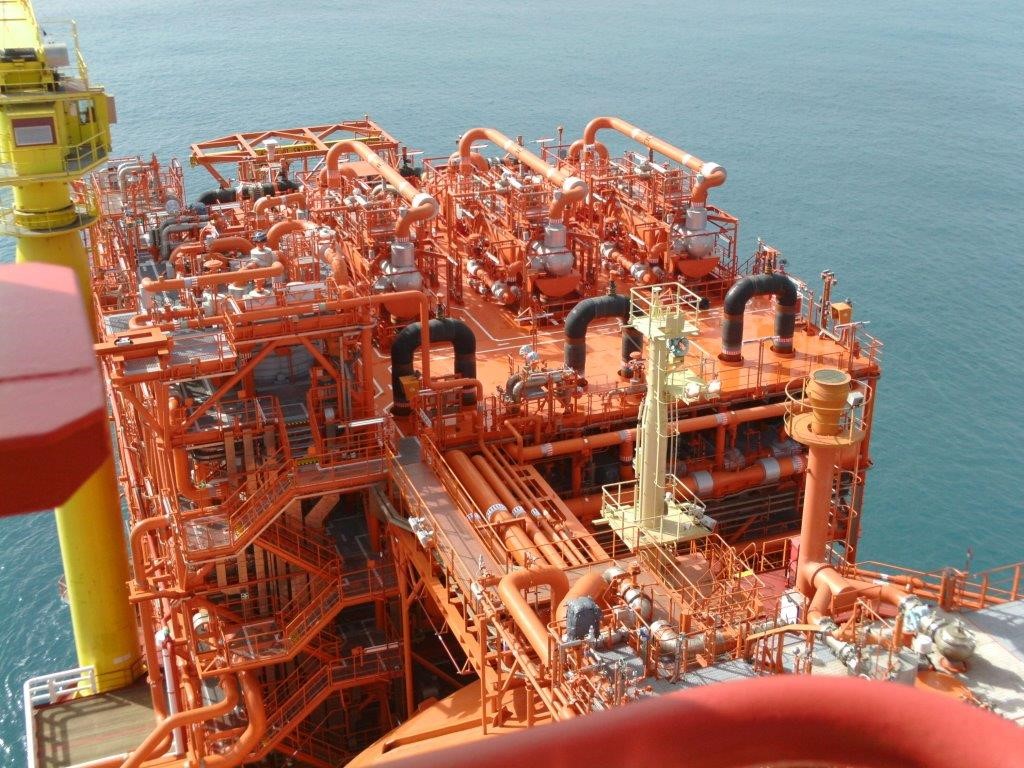
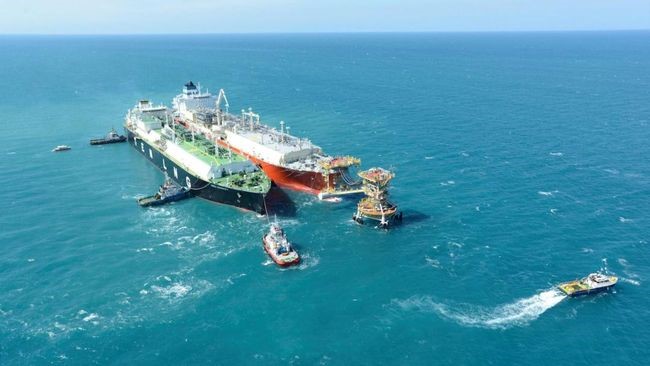
- Regasification Typologies. There are two main concepts for offshore LNG terminals: Gravity Base Structures (GBS), and Floating Storage and Regasification Units (FSRU). The design selection depends on site conditions (e.g. water depth, subsea soil characteristics, marine conditions) and sendout capacities (Kulish et al., 2005). A GBS is a fixed concrete structure laying on the sea floor, where LNG storage tanks and regasification equipment are placed. The first GBS-based regasification facility in the world was the Adriatic LNG terminal (ALT), Northern Adriatic Sea, Italy. The concrete structure set down in 30 m of water and includes two LNG storage tanks, the regasification plant, mooring and unloading facilities for LNG carrier ships. The ALT dimensions are 47 meters height, 88 meters width, and 180 meters length, which compare closely to the dimensions of a large FSRU ship. Actually, a FSRU is a LNG ship that can either be a specific design or a modification of an existing LNG carrier to include the regasification facility. Being intrinsically floating structures, they can either moored to the seabed via a turret mooring system or tethered to a jetty in a port area.
- Regasification Processes. The regasification process relies on the presence of certain units designed to perform specific operations. The first operation in the regasification process is the transfer of LNG from the carrier to terminal or FSRU and is performed via LNG arms.
The design is different in the case of an onshore terminal with respect to a FSRU. In the former case, each arm consists of a riser pipe, inboard and outboard arm. The diameter of the arm varies between 16 and 24 in. Typically, an LNG swivel joint is installed between each pipe segment to accommodate the changing positions between the onshore and the ship components. Emergency release systems, quick connect/disconnect coupling (QCDC), and position monitoring systems are provided to ensure safe operation of the arms. A nitrogen purge is also provided for each arm for draining the content prior to disconnection from the ship. The flow rate capacity of a loading arm varies between 4,000 and 6,000 m3/hr. The typical configuration of the loading arm battery consists in two or three liquid loading arms, a vapor return arm, and a common spare arm for both liquid or vapor, depending on the operational needs.
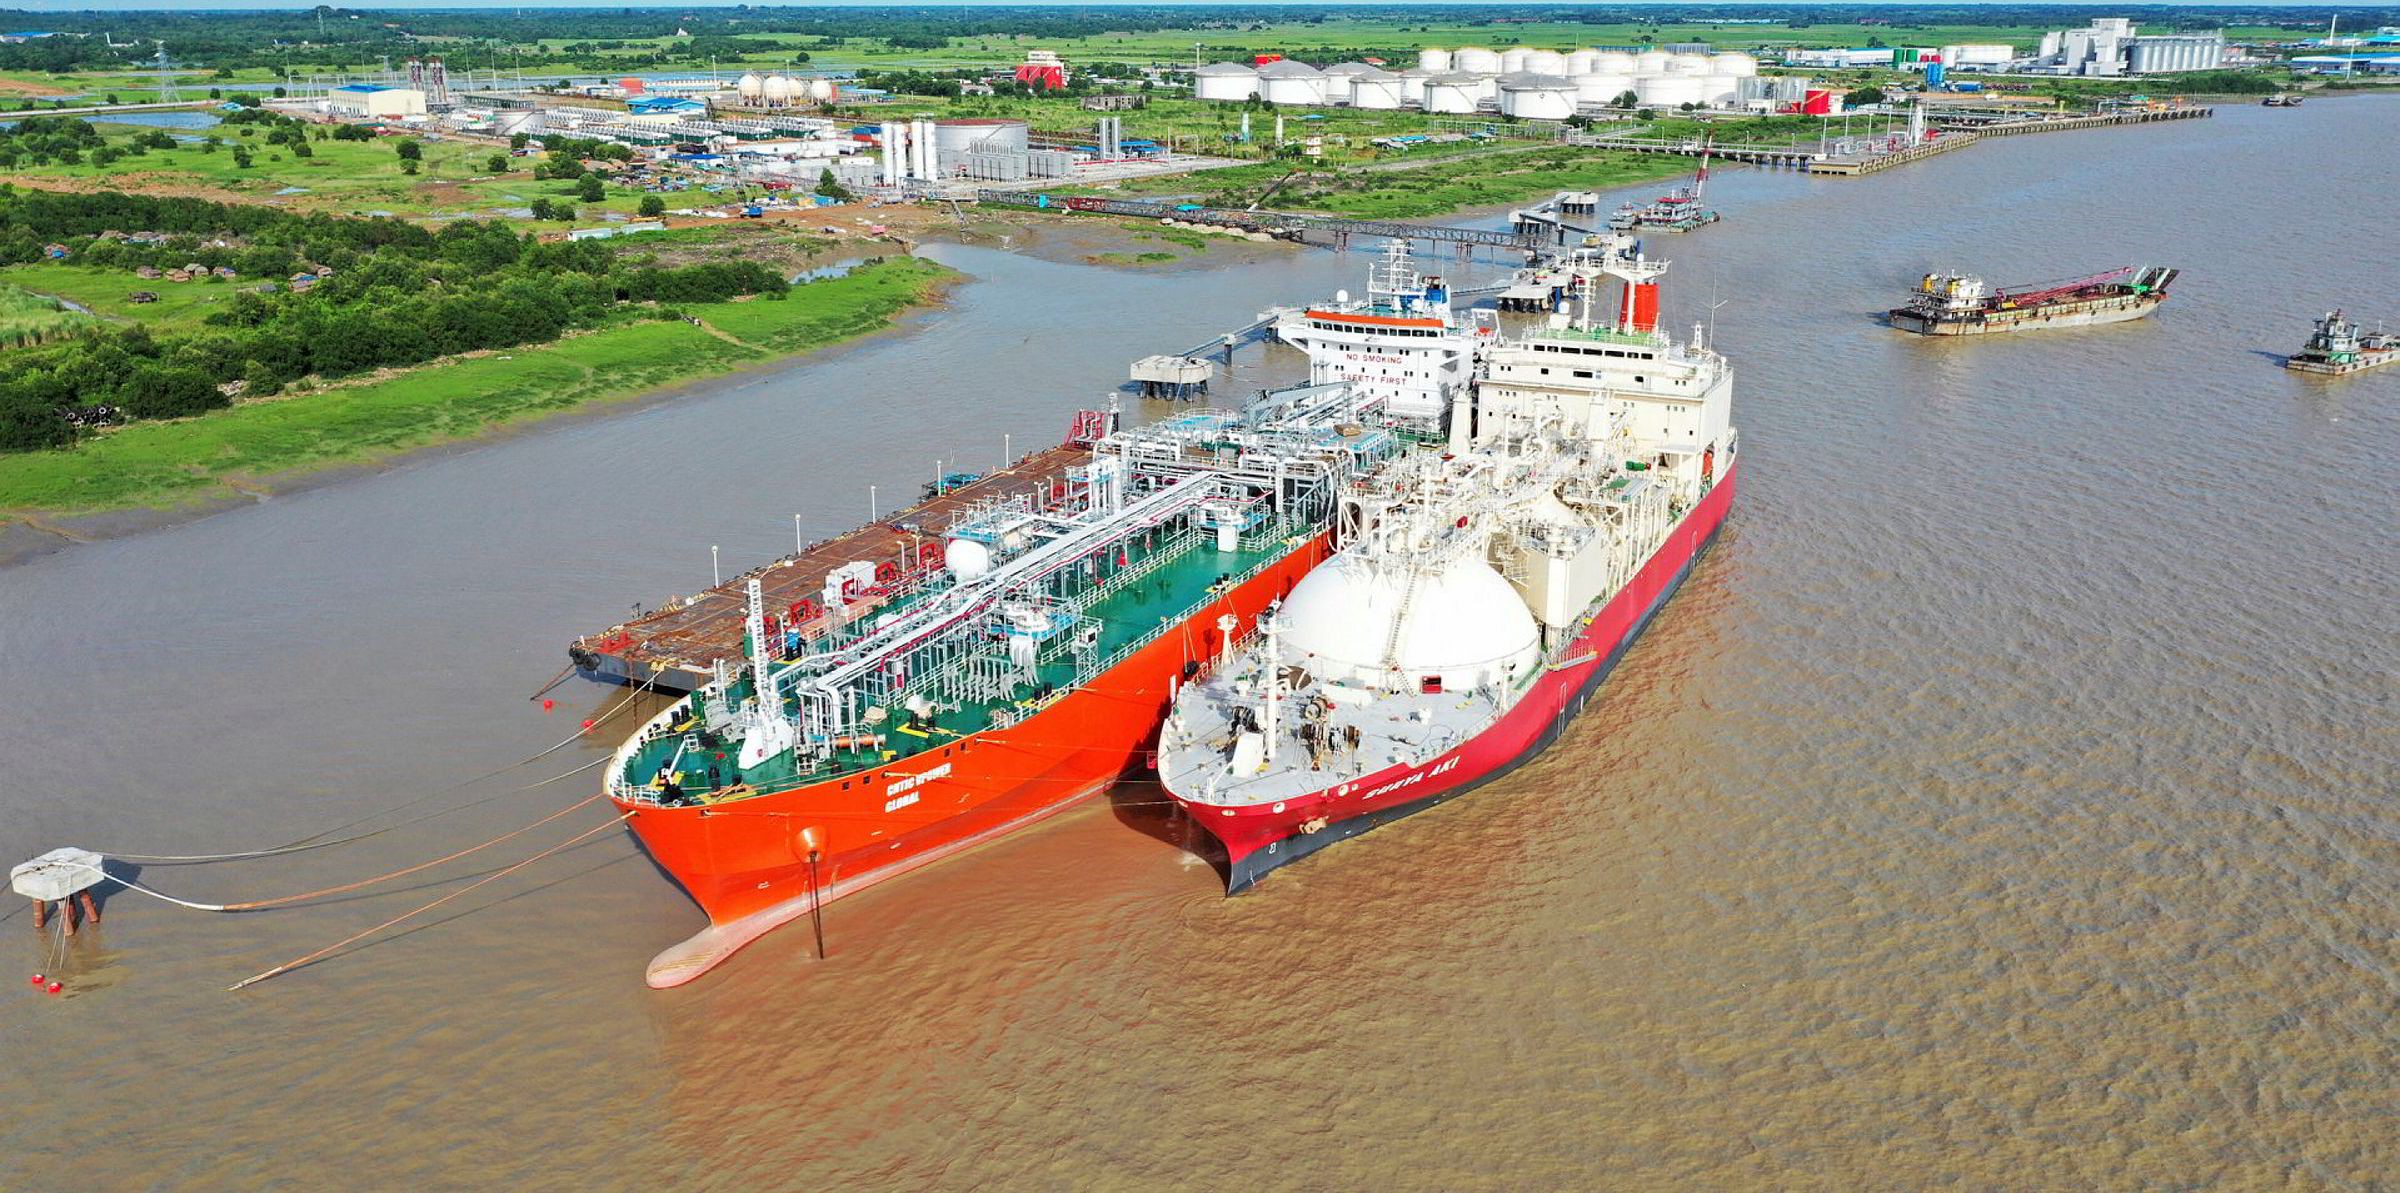
In the case of a FSRU, flexible cryogenic hoses are used for LNG transfer. Flexible hose present several advantages: it is worth to mention the possibility of connecting the LNG tanker and FSRU in both side by side and tandem configuration, or the possibility of operating in shallow water.
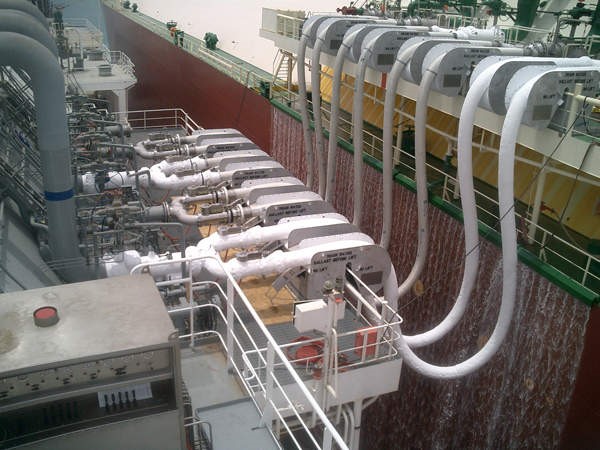
Composite LNG hoses typically consist of multiple polymeric films making a fluid-tight barrier to the LNG and woven fabric layers, providing mechanical strength, which are encapsulated between two stainless steel wire helices.
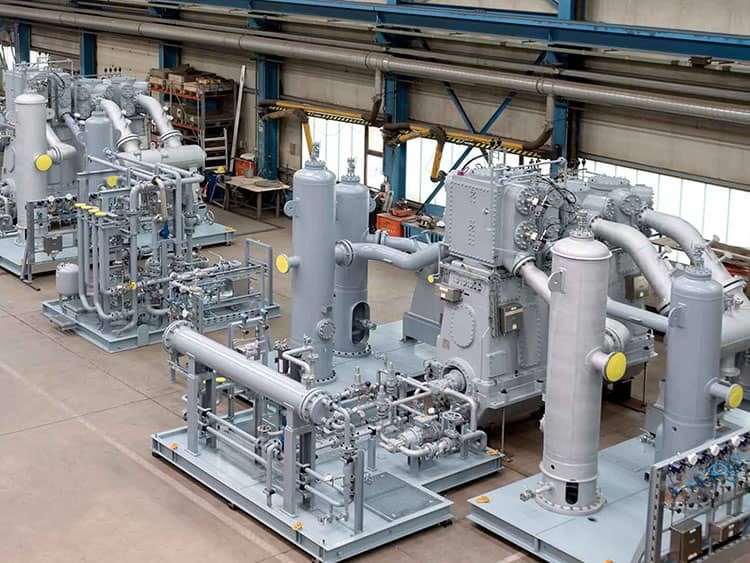
LNG pumping is generally achieved through submerged electric motor pump. The pump assembly along with electrical cables safely submerged in the dielectric liquid, avoiding the need of penetrating the tank and subsequent mechanical seals. Typically, a low pressure pump (LP sendout ) is designed to discharge at about 10 barg pressure in order to minimize boiled off gas (BOG) effect, which will be addressed later on in this section. The high pressure (HP sendout) pumps take suction from the BOG recondenser typically at about 8 barg pressure and increase the pressure to meet the sendout pressure requirements, whose range is 80 to 120 barg. Heat generated by the motor is mostly removed by the inlet LNG, a small portion of which is vaporized, vented from the pump casing and sent to the BOG recondenser.
The BOG condenser, the HP sendout pumps and the respective pipes constitutes a critical system for regasification operations, since pressure and fluid volumes may vary remarkably, which may be a challenge for continuous operations, so that equipment sizing has to be accurately engineered.
- Boil-off gas recondenser system. LNG vapors flow during ship unloading occurs because of heat exchanged by unloading pumps, unloading lines, heat leak to the storage tanks and volume displaced from the tank by the unloaded liquid. These vapors must be compressed, removed, and condensed in the BOG recondenser to maintain the storage tank at a low pressure. A portion of the vapor is returned to the ship, and the majority is recondensed in the BOG recondenser. During the holding operation, when the ship is not at port, vapor flow is significantly lower. BOG is generated mainly due to heat leak to the storage tanks, typically 0.05 volume % per day. When the plant operates at high sendout, the BOG flow is further reduced and can become negative such that makeup vapor from the natural gas sendout system may be required. Typically, the vapor rate varies from 0.1 to 1 MCM between holding and ship unloading operations. These vapor flows are compressed by the BOG compressor and recovered in the BOG recondenser. Finally, BOG recondenser serves also as a pressure and liquid volume buffer for the HP sendout pump, allowing its smooth operation.
Another key element in the regasification process is the vaporizing system. The principle of the vaporizer is warming up the LNG via a heat exchange device where a suitable working fluid at higher temperature than LNG itself. Although several types of vaporizers are available, most the existing plants use either the Open Rack Vaporizer (ORV) or the Submerged Combustion Vaporizer (SCV), the former covering almost 70% of applications.
An open rack vaporizer (ORV) is a heat exchanger with water as heating working fluid. These units generally are constructed from finned aluminium alloy tubes, properly protected by corrosion and arranged in panels. In most instances, the source of water is just the sea. This is obviously a natural choice for FSRU systems, with the notable exception of operation in very cold climates, where freezing issues may occur. In those instances, an hydrocarbon working fluid is introduced, that exchanges heat with water and release it to LNG at temperatures where water would freeze.
FLOATING STORAGE REGASIFICATION UNITS
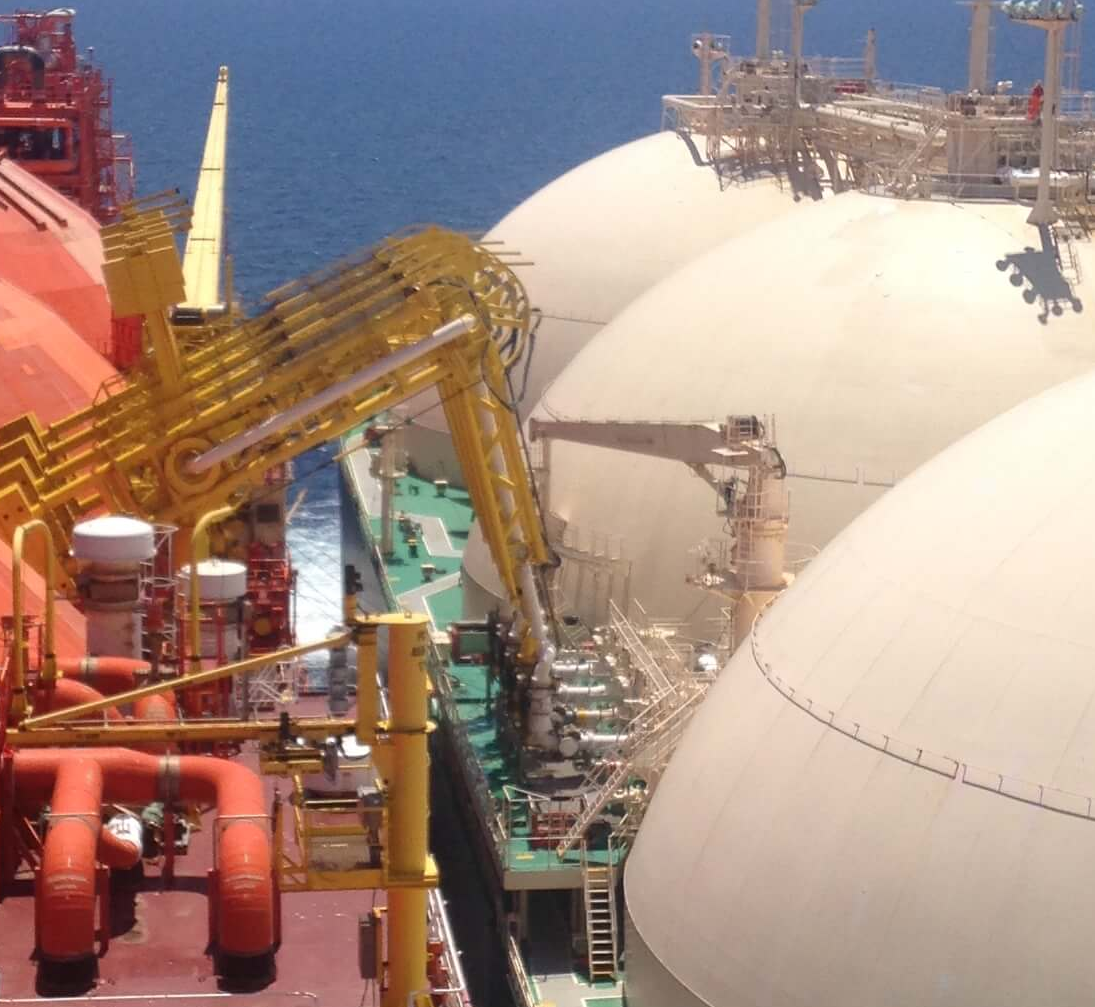
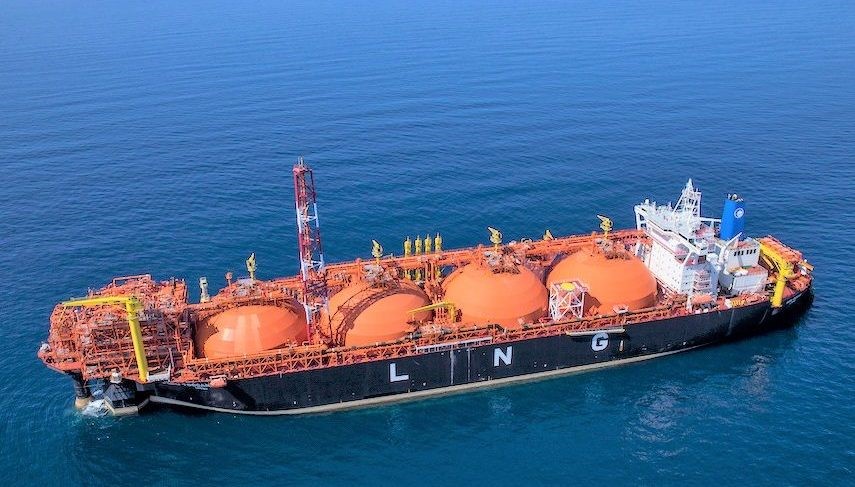
A Floating Regasification and Storage Unit (FSRU) is basically a special kind of ship. In particular, it is a Liquefied Natural Gas (LNG) storage ship provided with an onboard regasification plant capable of returning LNG back into a gaseous state and then supplying it directly into the gas network. FSRU ships vary in size: from 150 m long Karunia Dewata barge-like ship (25,000 m3 storage capacity) to 346 m long Challenger (storage capacity 263,000 m3). FSRUs and LNG ships have four to six separate heavily insulated cargo tanks inside their hull. There are two cargo tank designs commonly in use: Membrane tanks are box shaped so that the ship has a flat deck similar to ordinary tankers, which helps the installation of regasification equipment.
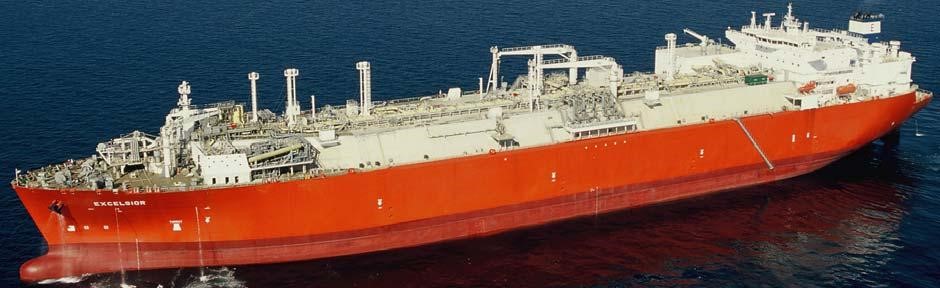
The other design is known as ‘Moss tanks’ that are spherical, giving LNG tankers their unmistakable appearance.
storing LNG at a temperature of -161°C in cryogenic storage tanks. The cold temperature keeps the LNG cargo in its liquid state until it is required for the gas network. LNG is generally stored and transported in bulk storage tanks at slightly above atmospheric pressure; usually less than 150 kPa (mbar) above. LNG conversion to gas is performed using seawater, which flows in the shell of vaporizer (‘tube and shell’ heat exchanger) while LNG passes through tubes. Seawater at the outlet of the vaporizer is about 7°C colder than at the inlet; outlet water is then blended back to ambient temperature. A FSRU typically discharges gas into the network at a pressure of around 60-80 Bar and a temperature of 5°C. Working at full capacity, a 170,000 m3 load would be re-gasified in about six days.
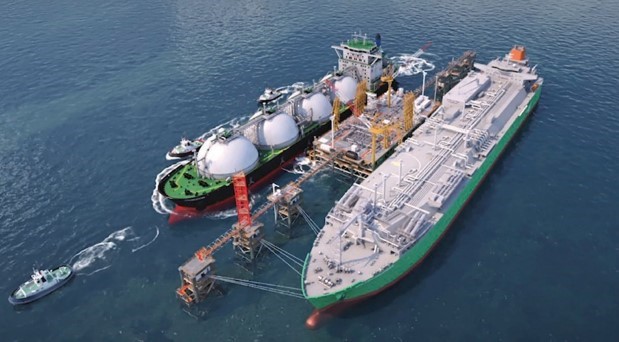
The FSRU concept has the great advantage of avoiding the impact of building large infrastructure onshore. As the FSRU is a real operating ship, when the project is over, the ship simply sails away with no redundant infrastructure left behind. FSRUs are also convenient for peak-shaving gas delivery to manage gas supply through high and low demand periods such as winter peak demand requirements. It is also possible for a FSRU to store gas on board until it is required or send it to available onshore storage facilities, so that more LNG can be imported to the FSRU. FSRUs are usually permanently moored at a jetty, (single berth) but other configuration are possible.
In single berth configuration, the tanker and the FSRU moor alongside the FSRU and offload LNG for regasification and then supply directly into a pipeline. This low-cost option works best in protected harbors or near-shore with water depths of 15-30m and mild weather conditions.
There are numerous Single Point mooring options, which include mooring towers, yokes or turrets.
Segregated berths for LNG ships and FSRUs are a very flexibile solution from the marine point of view, since berths can be connected in series to accommodate more FSRU, while keeping the infrastructure light.
ECONOMICAL ASPECTS
For several years FSRUs remained a relatively niche opportunity in the energy business. Starting from early 2000, there has been a significant lift in deployment of the technology as costs and capability have been optimised and FSRU units are being used to access new markets.
The global FSRU fleet currently consists of approximately 48 vessels, with processing capabilities ranging from 2 to 6 MTPA of LNG.
Modern FSRUs provide the quite same full processing capability as land based terminals including full boil-off gas management facilities, and this is a key factor in the economics of a LNG project.
Actually, there are three key reasons supporting investment in FSRUs: compared to onshore terminals
- Lower capital cost: the cost of a new FSRU (about 350 M USD) is half that of a terminal; on the other hand, OPEX are higher for a FSRU compared to the onshore installation
- shorter lead time: A brand newFSRU can be completed in less than 3 years; conversion from a LNG tanker may take 1,5 years. Actually, the lead time is often imposed by the infrastructure onshore (jetty, piping, storage tanks, etc). Of course, if an existing FSRU is chartered, lead time is measured in months
- greater flexibility: FSRU can be used as either a floating regas terminal (with storage), a floating storage unit or as a conventional LNG vessel, making possible to take advantage of favourable market opportunities. Moreover, FSRU can provide an early gas option prior to a decision to build a permanent onshore terminal. There is also the possibility to take back and re-use the FSRU infrastructure at relatively low cost which reduces risk around stranded regas assets. Combined FSRU/power combinations (FSRU tethered to a barge with gas-fired generators) offer opportunities in emerging markets.
ENVIRONMENTAL PERSPECTIVES
FSRUs possess several features which make them attractive from the environment point of view. Environmental considerations play a crucial role in the development and operation of Floating Storage and Regasification Units (FSRUs). As the world seeks to transition to a more sustainable energy future, FSRUs offer certain environmental advantages over traditional LNG import terminals. Here are key points to expand upon:
- Reduced Emissions: FSRUs contribute to the reduction of greenhouse gas emissions compared to other fossil fuels. Natural gas, when used as a cleaner energy alternative, emits lower levels of carbon dioxide (CO2), nitrogen oxides (NOx), and sulfur oxides (SOx) during combustion. By facilitating the importation and distribution of LNG, FSRUs enable access to cleaner energy sources and help mitigate climate change. Moreover, FSRUs (and LNG tankers) are powered by the LNG stored onboard: a LNG ship will only be carrying relatively small quantities of non-LNG fuels to power non-propulsion systems, which reduces the possibility and the extent of fuel spills.
- Utilization of Boil-Off Gas: FSRUs efficiently utilize boil-off gas (BOG), which is the natural evaporation of LNG during storage. Instead of venting the BOG into the atmosphere, FSRUs capture and utilize it as a valuable fuel source. The BOG can be re-gasified and used for onboard power generation, reducing the need for additional fuel consumption and minimizing emissions.
- Advanced Emission Control Technologies: FSRUs are equipped with advanced emission control technologies to further minimize their environmental impact. These technologies include gas combustion units, selective catalytic reduction (SCR) systems, and exhaust gas scrubbers, which help reduce air pollutants and ensure compliance with stringent emission regulations.
- Environmental Monitoring and Compliance: FSRUs adhere to rigorous environmental monitoring and compliance protocols. Operators implement measures to monitor and control air emissions, water discharge, and noise levels. Regular monitoring and reporting help ensure compliance with environmental regulations and maintain the integrity of marine ecosystems.
- Environmental Impact Assessments: Before the deployment of an FSRU project, thorough environmental impact assessments (EIAs) are conducted. EIAs evaluate the potential environmental effects of the project, including its impact on marine ecosystems, air quality, and local communities. These assessments help identify mitigation measures to minimize any adverse environmental effects.
- Collaboration with Stakeholders: FSRU projects often involve collaboration with various stakeholders, including government authorities, environmental organizations, and local communities. Engaging stakeholders in the planning and decision-making processes helps address environmental concerns, fosters transparency, and promotes sustainable practices.
- Research and Development: Continued research and development efforts are focused on improving the environmental performance of FSRUs. This includes advancements in emission control technologies, enhanced efficiency in regasification processes, and the development of alternative fuel sources for power generation onboard FSRUs.
By incorporating these environmental considerations, FSRUs contribute to a more sustainable and responsible approach to LNG importation, aligning with global efforts to reduce carbon emissions and promote cleaner energy sources.
In addition to the considerations above, it is important to acknowledge that LNG itself is fundamentally chilled methane, clear, colourless and odourless. Any spillage would result in rapid evaporation with substantially no impact on the surrounding environment. On the other hand, methane is known to be a stronger greenhouse gas than CO2 and any spillage of it should be avoided, although the amount presumably released in a spill would be small compared to the amount of CO2 released in the atmosphere, which would keep the impact on the global warming at a very low, if not negligible, level. The environmental damage associated with an LNG spill would be confined to fire and freezing impacts near the spill since LNG dissipates completely and leaves no residue (as crude oil does).
By the way, safety considerations prompted the industry to deploy as many as possible prevention systems and procedures to avoid incidents and spillage. The starting point is that natural gas is combustible, so an uncontrolled release of LNG (although in its liquid state it cannot explode or burn) may pose a serious hazard of explosion or fire. Being LNG extremely cold, this may cause injures to people or damages to equipment through direct contact. The major risks associated to LNG uncontrolled release that have been identified during a number of safety assessment performed along the years are pool fires, flammable vapour clouds and flameless explosion.
Pool fire is acknowledged to be the most serious hazard LNG release may cause. If LNG spills near an ignition source, the evaporating gas in a combustible gas-air concentration will burn above the LNG pool. The resulting “pool fire” would spread as the LNG pool expanded away from its source and continued evaporating. Such pool fires are intense, hotter and faster spreading than gasoline fires. They cannot be extinguished; their thermal radiation may injure people and damage property a considerable distance from the fire itself.
If LNG spills but does not immediately ignite, the evaporating natural gas will form a vapour cloud that may move away from spill site and eventually be ignited by some source, causing a fire, without explosion, since only the portion of cloud with certain gas/oxygen concentration will burn. In case of LNG spill on water, it could in principle heat up and regasify almost instantly in a “flameless explosion” (also called a “rapid phase transition”). This scenario has been evaluated on the basis of small scale LNG spills (no large scale LNG spill occurred to date), indicating that flameless explosion is likely lmuch less important than the previous two issues.
The safety hazards associated with LNG terminals have been debated for decades., especially after two major disasters occurred in the past.
The first LNG related incident happened to East Ohio gas Co. of Cleveland on 1944. The fire caused the death of 128 people. Another tragic event occurred in 2004 at Algeria’s Skikda LNG terminal, where 78 people died.
In the former case, the probable reason was identified in the carbon steel used to build the storage tank, unsuitable for low temperature service, that resulted in a failure and subsequent spill. In the latter, the most likely cause was a failure induced by mercury not removed from gas which caused the embrittlement of the aluminium-built low temperature separator.
Since then, technology improvements and standards have made LNG facilities much safer. In this respect, the LNG tanker industry claims a good record of relative safety over the last 64 years; since international LNG shipping began in 1959, tankers reportedly have carried over 90,000 LNG cargoes without any serious accident at sea or in port. The LNG marine safety record is due to several factors. A very important one is the double-hulled design of LNG tankers and FSRUs. This design makes them more robust and less prone to accidental spills than single-hulled oil tankers like the Exxon Valdez, responsible for the Alaskan oil spill after grounding in 1989. A second determinant factor is the deployment of up-to-date safety technologies in LNG-carrying ships like radar, global positioning systems, automatic distress systems and beacons to signal. Last but not least, the Emergency Shut-Down (ESD) system monitors the operation parameters, as well as detection systems and interrupts operation as soon as some deviation from normal occurs.
REGASIFICATION STATISTICS
Figures of LNG trade indicate a progressive growth of the sector along the years. Presently, the global LNG trade is worth of 516 BCM as gas equivalent (Statista, Jan 2023), to be compared with the total natural gas trade figure of 4014 BCM of worldwide gas production (IEA, 2020). In the course of 2022 the global LNG supply growth increased by 5%, a relatively small figure if one takes into account the gas crisis induced by the interruption of gas shipment from Russia. While EU purchased 66 BCM of gas from LNG, the rest of the world reduced its requests with respect to 2021. USA supplied about two thirds of LNG imported by EU.
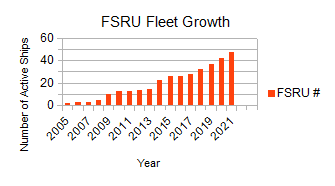
The number of active Floating Storage and Regasification Units (FSRUs) has been steadily increasing over the years. As of 2021, there were around 30 operational FSRUs worldwide. This number is expected to continue growing as more countries and regions adopt FSRU technology to meet their liquefied natural gas (LNG) import requirements. According to Statista website, FSRU Fleet reached 48 ships in May 2022; 25 out of 48 with storage capacity between 160,000 and 180,000 cubic meters. Other FSRU class may store from 25,000 to 130,000 cubic meters. The following plot shows the trend of FSRU diffusion in the global market
FSRUs have played a significant role in the global LNG supply chain. While precise data on the volume of LNG handled specifically by FSRUs versus onshore terminals is not readily available, FSRUs have demonstrated their ability to handle substantial LNG volumes. They have been employed in various regions, including Europe, Asia, the Americas, and the Middle East, to provide flexible and efficient LNG regasification infrastructure. In terms of regasification capacity, offshore regasification mounts to 116 MTPA, vs. a total capacity of 850 MTPA (source IGU, 2021).
FSRUs have been particularly popular in regions with limited onshore LNG infrastructure or where the demand for natural gas fluctuates. For example, countries in Southeast Asia, such as Indonesia, Malaysia, and Bangladesh, have embraced FSRUs to quickly establish LNG import capabilities. Europe has also seen significant FSRU deployment, with countries like Greece, Lithuania, and Croatia using FSRUs to enhance their energy diversification and security.
The FSRU sector has witnessed steady growth in the number of projects under development or in the planning stage. Several countries, including those without previous LNG import capabilities, are considering FSRUs as an attractive solution due to their shorter lead times and lower infrastructure costs compared to onshore terminals. This trend indicates a positive outlook for the expansion of the FSRU market in the future.
It’s important to consult the latest reports and industry sources to obtain the most up-to-date and accurate statistics on global regasification, including the number of active FSRUs, their locations, and the volume of LNG handled.
The FSRU fleet is still a minor fraction of the total LNG ships fllet, that today counts on 700 vessels worldwide.
CONCLUSIVE REMARKS
The present economic and political conditions have accelerated a trend in LNG use that was already in place, although conditioned by economy fluctuations and limited by the availability of cheap gas from Russian Federation. Today’s global context of the energy demand determines, especially in EU, a vigorous gas supply which also requires quick implementation, flexibility in the selection of energy sources avoiding unreliable ones, contained environmental and social impact, cost-effectiveness and compatibility with the energy transition goals. The FSRU solution meets these goals in a satisfactory manner and it is not an overstatement that FSRUs really deserve their present and probably future success in world’s energy play.
LNG UNIT CONVERSION TABLE
- 1 million tonnes (LNG) = 48.7 Bcf* (gas) = 1.379 Bcm (gas)
- 1 Bcf (gas) = 45,000 cubic meters (LNG)
- 1 million tonnes per year (mtpa) (LNG) = 48.7 Bcf/year* (gas) = 1.379 Bcm/year (gas)
- 1 cubic meter (m3) = 35.315 Cubic feet (cf)
- 1 tonne (LNG) = 53.57 MMBtu**
- 1 kilocalorie (kcal) = 4.187 kilojoule (kJ) = 3.968 Btu
- 1 Dth (dekatherm) = 1 MMBtu = 10 therms = 1,000,000 Btu
* Assumes a specific gravity of LNG at 0.45
** Assumes a natural gas heating value of 1,100 Btu/cf


![Lower heating value [MJ/kg] for different types of hydrocarbons](https://www.oil-gasportal.com/wp-content/uploads/2020/07/Immagine2.png)


